
Page 362 -
P. 362
342 CHAPTER 7 TRANSPORTATION, ASSIGNMENT AND TRANSSHIPMENT PROBLEMS
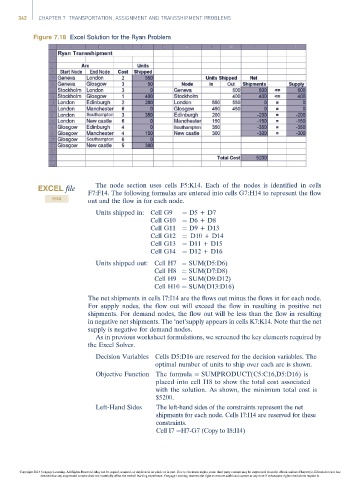
Figure 7.18 Excel Solution for the Ryan Problem
The node section uses cells F5:K14. Each of the nodes is identified in cells
EXCEL file
F7:F14. The following formulas are entered into cells G7:H14 to represent the flow
RYAN
out and the flow in for each node.
Units shipped in: Cell G9 ¼ D5 + D7
Cell G10 ¼ D6 + D8
Cell G11 ¼ D9 + D13
Cell G12 ¼ D10 + D14
Cell G13 ¼ D11 + D15
Cell G14 ¼ D12 + D16
Units shipped out: Cell H7 ¼ SUM(D5:D6)
Cell H8 ¼ SUM(D7:D8)
Cell H9 ¼ SUM(D9:D12)
Cell H10 ¼ SUM(D13:D16)
The net shipments in cells I7:I14 are the flows out minus the flows in for each node.
For supply nodes, the flow out will exceed the flow in resulting in positive net
shipments. For demand nodes, the flow out will be less than the flow in resulting
in negative net shipments. The ‘net’supply appears in cells K7:K14. Note that the net
supply is negative for demand nodes.
As in previous worksheet formulations, we screened the key elements required by
the Excel Solver.
Decision Variables Cells D5:D16 are reserved for the decision variables. The
optimal number of units to ship over each arc is shown.
Objective Function The formula ¼ SUMPRODUCT(C5:C16,D5:D16) is
placed into cell I18 to show the total cost associated
with the solution. As shown, the minimum total cost is
$5200.
Left-Hand Sides The left-hand sides of the constraints represent the net
shipments for each node. Cells I7:I14 are reserved for these
constraints.
Cell I7 ¼H7-G7 (Copy to I8:I14)
Copyright 2014 Cengage Learning. All Rights Reserved. May not be copied, scanned, or duplicated, in whole or in part. Due to electronic rights, some third party content may be suppressed from the eBook and/or eChapter(s). Editorial review has
deemed that any suppressed content does not materially affect the overall learning experience. Cengage Learning reserves the right to remove additional content at any time if subsequent rights restrictions require it.