
Page 504 -
P. 504
484 CHAPTER 11 QUEUING MODELS
a. What are the mean arrival and treatment rates in terms of patients per minute?
b. What is the average number of patients in the waiting room?
c. If a patient arrives at 10:10 A.M., at what time is the patient expected to leave the office?
14 A study of a multiple-channel food-service operation shows that the average time between
the arrival of a customer at the food-service counter and his or her departure with a filled
order is ten minutes. Customers arrive at the average rate of four per minute. The food-
service operation requires an average of two minutes per customer order.
a. What is the mean service rate per channel in terms of customers per minute?
b. What is the average waiting time in the line prior to placing an order?
c. On average, how many customers are in the food-service system ?
15 Gubser Welding, Inc., operates a welding service for construction and automotive repair
jobs. Assume that the arrival of jobs at the company’s office can be described by a Poisson
probability distribution with a mean arrival rate of two jobs per eight-hour day. The time
required to complete the jobs follows a normal probability distribution with a mean time of
3.2 hours and a standard deviation of two hours. Answer the following questions, assuming
that Gubser uses one welder to complete all jobs.
a. What is the mean arrival rate in jobs per hour?
b. What is the mean service rate in jobs per hour?
c. What is the average number of jobs waiting for service?
d. What is the average time a job waits before the welder can begin working on it?
e. What is the average number of hours between when a job is received and when it is
completed?
f. What percentage of the time is Gubser’s welder busy?
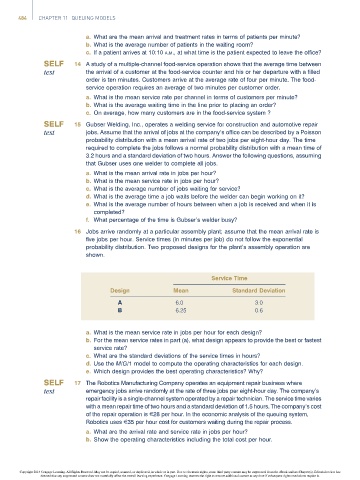
16 Jobs arrive randomly at a particular assembly plant; assume that the mean arrival rate is
five jobs per hour. Service times (in minutes per job) do not follow the exponential
probability distribution. Two proposed designs for the plant’s assembly operation are
shown.
Service Time
Design Mean Standard Deviation
A 6.0 3.0
B 6.25 0.6
a. What is the mean service rate in jobs per hour for each design?
b. For the mean service rates in part (a), what design appears to provide the best or fastest
service rate?
c. What are the standard deviations of the service times in hours?
d. Use the M/G/1 model to compute the operating characteristics for each design.
e. Which design provides the best operating characteristics? Why?
17 The Robotics Manufacturing Company operates an equipment repair business where
emergency jobs arrive randomly at the rate of three jobs per eight-hour day. The company’s
repair facility is a single-channel system operated by a repair technician. The service time varies
with a mean repair time of two hours and a standard deviation of 1.5 hours. The company’s cost
of the repair operation is E28 per hour. In the economic analysis of the queuing system,
Robotics uses E35 perhourcostfor customers waiting during therepair process.
a. What are the arrival rate and service rate in jobs per hour?
b. Show the operating characteristics including the total cost per hour.
Copyright 2014 Cengage Learning. All Rights Reserved. May not be copied, scanned, or duplicated, in whole or in part. Due to electronic rights, some third party content may be suppressed from the eBook and/or eChapter(s). Editorial review has
deemed that any suppressed content does not materially affect the overall learning experience. Cengage Learning reserves the right to remove additional content at any time if subsequent rights restrictions require it.