
Page 271 - Analysis and Design of Energy Geostructures
P. 271
246 Analysis and Design of Energy Geostructures
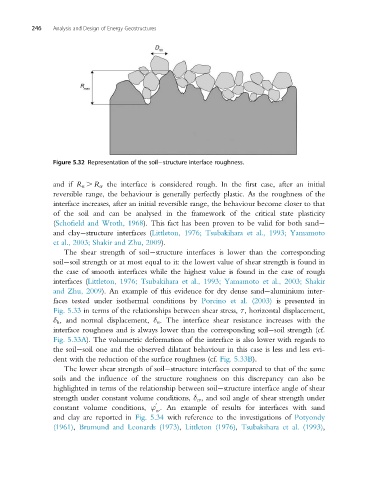
Figure 5.32 Representation of the soil structure interface roughness.
and if R n . R cr the interface is considered rough. In the first case, after an initial
reversible range, the behaviour is generally perfectly plastic. As the roughness of the
interface increases, after an initial reversible range, the behaviour become closer to that
of the soil and can be analysed in the framework of the critical state plasticity
(Schofield and Wroth, 1968). This fact has been proven to be valid for both sand
and clay structure interfaces (Littleton, 1976; Tsubakihara et al., 1993; Yamamoto
et al., 2003; Shakir and Zhu, 2009).
The shear strength of soil structure interfaces is lower than the corresponding
soil soil strength or at most equal to it: the lowest value of shear strength is found in
the case of smooth interfaces while the highest value is found in the case of rough
interfaces (Littleton, 1976; Tsubakihara et al., 1993; Yamamoto et al., 2003; Shakir
and Zhu, 2009). An example of this evidence for dry dense sand aluminium inter-
faces tested under isothermal conditions by Porcino et al. (2003) is presented in
Fig. 5.33 in terms of the relationships between shear stress, τ, horizontal displacement,
δ h , and normal displacement, δ n . The interface shear resistance increases with the
interface roughness and is always lower than the corresponding soil soil strength (cf.
Fig. 5.33A). The volumetric deformation of the interface is also lower with regards to
the soil soil one and the observed dilatant behaviour in this case is less and less evi-
dent with the reduction of the surface roughness (cf. Fig. 5.33B).
The lower shear strength of soil structure interfaces compared to that of the same
soils and the influence of the structure roughness on this discrepancy can also be
highlighted in terms of the relationship between soil structure interface angle of shear
strength under constant volume conditions, δ cv , and soil angle of shear strength under
0
constant volume conditions, ϕ . An example of results for interfaces with sand
cv
and clay are reported in Fig. 5.34 with reference to the investigations of Potyondy
(1961), Brumund and Leonards (1973), Littleton (1976), Tsubakihara et al. (1993),