
Page 43 - Analysis and Design of Energy Geostructures
P. 43
12 Analysis and Design of Energy Geostructures
results from (1) the formation of the planet, (2) the radioactive decay of minerals and
(3) the solar energy absorbed at the surface. It is contained in approximately
21
1.084 3 10 cubic metres of rocks and metallic alloys located in the Earth subsurface
(Lee et al., 2007). Ninety-nine percent of this volume is characterised by a tempera-
ture higher than 1000 C, while only 0.1% is characterised by a temperature lower
than 100 C(Barbier, 2002).
1.3.2 Geothermal gradient
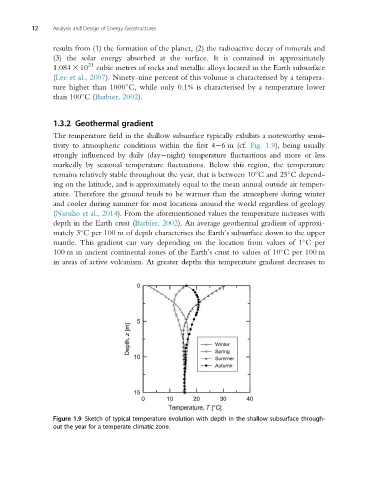
The temperature field in the shallow subsurface typically exhibits a noteworthy sensi-
tivity to atmospheric conditions within the first 4 6 m (cf. Fig. 1.9), being usually
strongly influenced by daily (day night) temperature fluctuations and more or less
markedly by seasonal temperature fluctuations. Below this region, the temperature
remains relatively stable throughout the year, that is between 10 C and 25 C depend-
ing on the latitude, and is approximately equal to the mean annual outside air temper-
ature. Therefore the ground tends to be warmer than the atmosphere during winter
and cooler during summer for most locations around the world regardless of geology
(Narsilio et al., 2014). From the aforementioned values the temperature increases with
depth in the Earth crust (Barbier, 2002). An average geothermal gradient of approxi-
mately 3 C per 100 m of depth characterises the Earth’s subsurface down to the upper
mantle. This gradient can vary depending on the location from values of 1 C per
100 m in ancient continental zones of the Earth’s crust to values of 10 C per 100 m
in areas of active volcanism. At greater depths this temperature gradient decreases to
Figure 1.9 Sketch of typical temperature evolution with depth in the shallow subsurface through-
out the year for a temperate climatic zone.