
Page 112 - Analysis, Synthesis and Design of Chemical Processes, Third Edition
P. 112
(E3.1o)
(E3.1p)
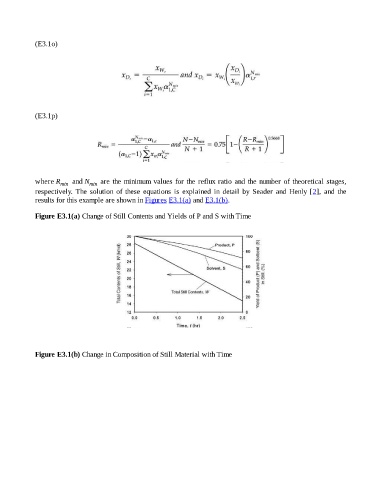
where R min and N min are the minimum values for the reflux ratio and the number of theoretical stages,
respectively. The solution of these equations is explained in detail by Seader and Henly [2], and the
results for this example are shown in Figures E3.1(a) and E3.1(b).
Figure E3.1(a) Change of Still Contents and Yields of P and S with Time
Figure E3.1(b) Change in Composition of Still Material with Time