
Page 233 - Analysis, Synthesis and Design of Chemical Processes, Third Edition
P. 233
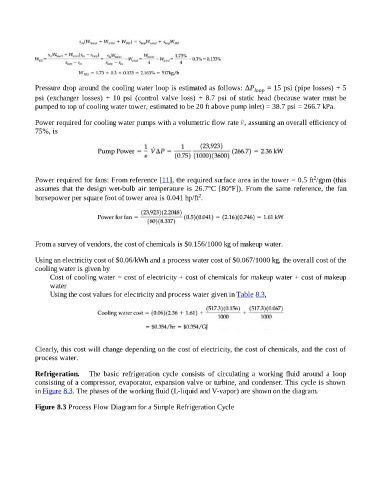
Pressure drop around the cooling water loop is estimated as follows: ΔP              loop  = 15 psi (pipe losses) + 5

                    psi  (exchanger  losses)  +  10  psi  (control  valve  loss)  +  8.7  psi  of  static  head  (because  water  must  be
                    pumped to top of cooling water tower, estimated to be 20 ft above pump inlet) = 38.7 psi = 266.7 kPa.


                    Power required for cooling water pumps with a volumetric flow rate  , assuming an overall efficiency of
                    75%, is


                                                                                                                                2
                    Power required for fans: From reference [11], the required surface area in the tower = 0.5 ft /gpm (this
                    assumes that the design wet-bulb air temperature is 26.7°C [80°F]). From the same reference, the fan
                                                                                   2
                    horsepower per square foot of tower area is 0.041 hp/ft .


                    From a survey of vendors, the cost of chemicals is $0.156/1000 kg of makeup water.


                    Using an electricity cost of $0.06/kWh and a process water cost of $0.067/1000 kg, the overall cost of the
                    cooling water is given by
                          Cost of cooling water = cost of electricity + cost of chemicals for makeup water + cost of makeup
                          water
                          Using the cost values for electricity and process water given in Table 8.3,


                    Clearly, this cost will change depending on the cost of electricity, the cost of chemicals, and the cost of
                    process water.


                    Refrigeration.      The  basic  refrigeration  cycle  consists  of  circulating  a  working  fluid  around  a  loop
                    consisting of a compressor, evaporator, expansion valve or turbine, and condenser. This cycle is shown
                    in Figure 8.3. The phases of the working fluid (L-liquid and V-vapor) are shown on the diagram.


                    Figure 8.3 Process Flow Diagram for a Simple Refrigeration Cycle