
Page 268 - Analysis, Synthesis and Design of Chemical Processes, Third Edition
P. 268
The numbers shown in Table E9.12 were obtained from this diagram.
Table E9.12 Summary of Discrete and Cumulative Cash Flows in Example 9.12
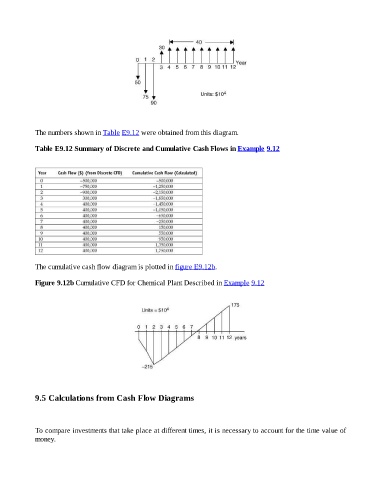
The cumulative cash flow diagram is plotted in figure E9.12b.
Figure 9.12b Cumulative CFD for Chemical Plant Described in Example 9.12
9.5 Calculations from Cash Flow Diagrams
To compare investments that take place at different times, it is necessary to account for the time value of
money.