
Page 300 - Analysis, Synthesis and Design of Chemical Processes, Third Edition
P. 300
6
Table E10.1 Nondiscounted After-Tax Cash Flows for Example 10.1 (All Numbers in $10 )
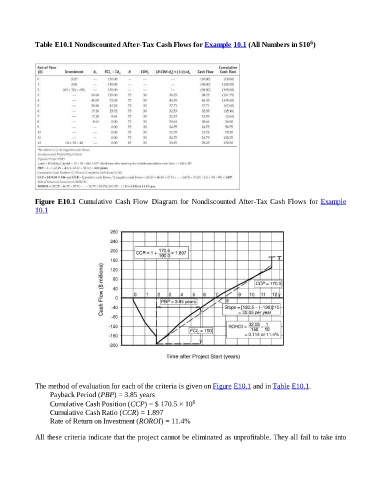
Figure E10.1 Cumulative Cash Flow Diagram for Nondiscounted After-Tax Cash Flows for Example
10.1
The method of evaluation for each of the criteria is given on Figure E10.1 and in Table E10.1.
Payback Period (PBP) = 3.85 years
Cumulative Cash Position (CCP) = $ 170.5 × 10 6
Cumulative Cash Ratio (CCR) = 1.897
Rate of Return on Investment (ROROI) = 11.4%
All these criteria indicate that the project cannot be eliminated as unprofitable. They all fail to take into