
Page 302 - Analysis, Synthesis and Design of Chemical Processes, Third Edition
P. 302
multiplying each cash flow by the discount factor (P/F, i, n), where n is the number of years after the start
of the project. These discounted cash flows are shown along with the cumulative discounted cash flows in
Table E10.2.
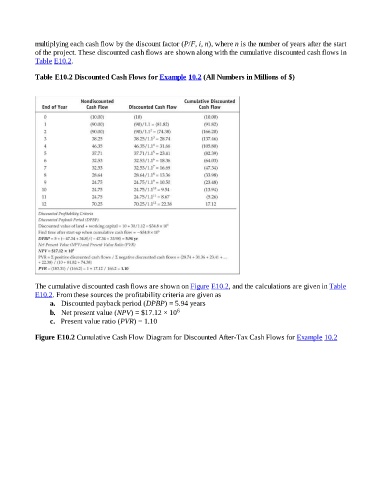
Table E10.2 Discounted Cash Flows for Example 10.2 (All Numbers in Millions of $)
The cumulative discounted cash flows are shown on Figure E10.2, and the calculations are given in Table
E10.2. From these sources the profitability criteria are given as
a. Discounted payback period (DPBP) = 5.94 years
b. Net present value (NPV) = $17.12 × 10 6
c. Present value ratio (PVR) = 1.10
Figure E10.2 Cumulative Cash Flow Diagram for Discounted After-Tax Cash Flows for Example 10.2