
Page 426 - Analysis, Synthesis and Design of Chemical Processes, Third Edition
P. 426
of state or other mixing rules, or a temperature-dependent BIP, may be needed. These often work better
for polar-nonpolar systems. However, running the simulation more than once with different BIPs and with
different thermodynamic models to judge the uncertainty of the result is recommended, as shown in
Example 13.4. If the difference between the simulations seriously affects the viability of the process, a
detailed uncertainty analysis is essential [11]. This is beyond the scope of this book.
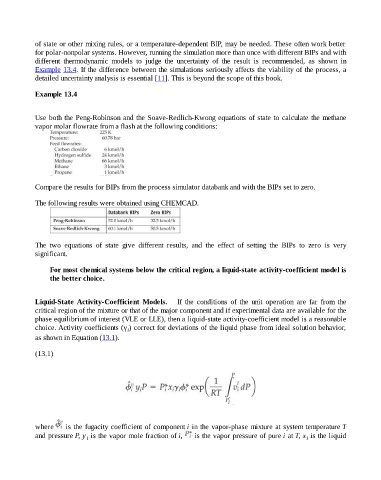
Example 13.4
Use both the Peng-Robinson and the Soave-Redlich-Kwong equations of state to calculate the methane
vapor molar flowrate from a flash at the following conditions:
Compare the results for BIPs from the process simulator databank and with the BIPs set to zero.
The following results were obtained using CHEMCAD.
The two equations of state give different results, and the effect of setting the BIPs to zero is very
significant.
For most chemical systems below the critical region, a liquid-state activity-coefficient model is
the better choice.
Liquid-State Activity-Coefficient Models. If the conditions of the unit operation are far from the
critical region of the mixture or that of the major component and if experimental data are available for the
phase equilibrium of interest (VLE or LLE), then a liquid-state activity-coefficient model is a reasonable
choice. Activity coefficients (γ ) correct for deviations of the liquid phase from ideal solution behavior,
i
as shown in Equation (13.1).
(13.1)
where is the fugacity coefficient of component i in the vapor-phase mixture at system temperature T
and pressure P, y is the vapor mole fraction of i, is the vapor pressure of pure i at T, x is the liquid
i
i