
Page 73 - Analysis, Synthesis and Design of Chemical Processes, Third Edition
P. 73
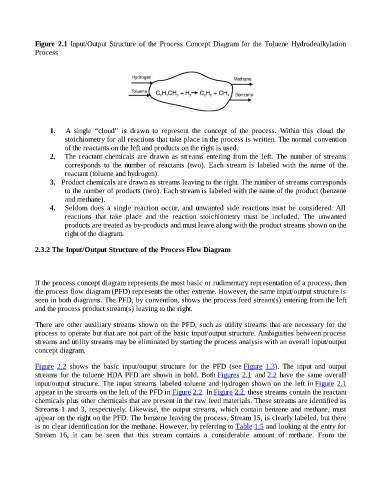
Figure  2.1  Input/Output  Structure  of  the  Process  Concept  Diagram  for  the  Toluene  Hydrodealkylation
                    Process


                          1.      A  single  “cloud”  is  drawn  to  represent  the  concept  of  the  process.  Within  this  cloud  the
                                stoichiometry for all reactions that take place in the process is written. The normal convention
                                of the reactants on the left and products on the right is used.
                          2.      The  reactant  chemicals  are  drawn  as  streams  entering  from  the  left.  The  number  of  streams
                                corresponds  to  the  number  of  reactants  (two).  Each  stream  is  labeled  with  the  name  of  the
                                reactant (toluene and hydrogen).
                          3.   Product chemicals are drawn as streams leaving to the right. The number of streams corresponds
                                to the number of products (two). Each stream is labeled with the name of the product (benzene

                                and methane).
                          4.      Seldom  does  a  single  reaction  occur,  and  unwanted  side  reactions  must  be  considered. All
                                reactions  that  take  place  and  the  reaction  stoichiometry  must  be  included.  The  unwanted
                                products are treated as by-products and must leave along with the product streams shown on the
                                right of the diagram.


                    2.3.2 The Input/Output Structure of the Process Flow Diagram


                    If the process concept diagram represents the most basic or rudimentary representation of a process, then
                    the process flow diagram (PFD) represents the other extreme. However, the same input/output structure is
                    seen in both diagrams. The PFD, by convention, shows the process feed stream(s) entering from the left
                    and the process product stream(s) leaving to the right.


                    There are other auxiliary streams shown on the PFD, such as utility streams that are necessary for the
                    process to operate but that are not part of the basic input/output structure. Ambiguities between process
                    streams and utility streams may be eliminated by starting the process analysis with an overall input/output
                    concept diagram.


                    Figure  2.2  shows  the  basic  input/output  structure  for  the  PFD  (see Figure  1.3).  The  input  and  output
                    streams for the toluene HDA PFD are shown in bold. Both Figures 2.1  and 2.2 have the same overall
                    input/output structure. The input streams labeled toluene and hydrogen shown on the left in Figure  2.1
                    appear in the streams on the left of the PFD in Figure 2.2. In Figure 2.2, these streams contain the reactant
                    chemicals plus other chemicals that are present in the raw feed materials. These streams are identified as
                    Streams 1 and 3, respectively. Likewise, the output streams, which contain benzene and methane, must
                    appear on the right on the PFD. The benzene leaving the process, Stream 15, is clearly labeled, but there
                    is no clear identification for the methane. However, by referring to Table 1.5 and looking at the entry for
                    Stream  16,  it  can  be  seen  that  this  stream  contains  a  considerable  amount  of  methane.  From  the