
Page 186 - Analytical method for food addtives
P. 186
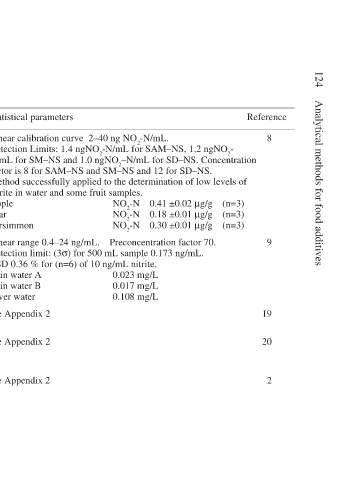
124  Analytical methods for food additives


                       Reference  8           9            19   20     2


                                       (n=3)  (n=3)  (n=3)


                                       0.41 ±0.02 µg/g  0.18 ±0.01 µg/g  0.30 ±0.01 µg/g  Preconcentration factor 70.  0.023 mg/L  0.017 mg/L  0.108 mg/L


                           Linear calibration curve  2–40 ng NO 2 -N/mL. Detection Limits: 1.4 ngNO 2 -N/mL for SAM–NS, 1.2 ngNO 2 - N/mL for SM–NS and 1.0 ngNO 2 –N/mL for SD–NS. Concentration factor is 8 for SAM–NS and SM–NS and 12 for SD–NS. Method successfully applied to the determination of low levels of nitrite in water and some fruit samples.


                       Statistical parameters  Apple  Pear  Persimmon  Linear range 0.4–24 ng/mL.  Rain water A  Rain water B  River water  see Appendix 2  see Appendix 2  see Appendix 2


                       Extent of validation  Precision of method established and applied to  real samples (n=3)  Precision of method established and applied to  real samples (n=3)  Repeatability and  reproducibility  Repeatability and  reproducibility  Repeatability


                           Water and fruit                 Milk and milk  Milk and milk  Milk and milk


                       Matrix                 Water          products  products  products


                   Table 9.2 cont’d  Method  Spectro-  photometric  Spectro-  photometric  Segmented flow  analyses  Flow injection  analyses with  in-line dialysis  Spectrometry