
Page 184 - Analytical method for food addtives
P. 184
E249–50: Nitrites 123
13 21
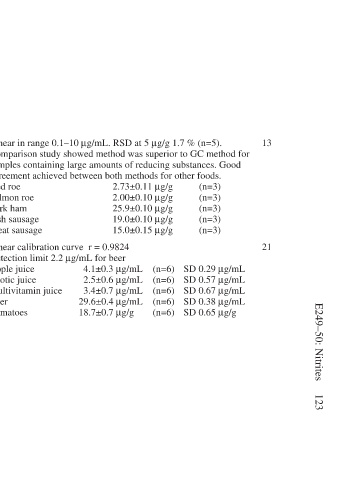
Comparison study showed method was superior to GC method for
SD 0.29 µg/mL SD 0.57 µg/mL SD 0.67 µg/mL SD 0.38 µg/mL
samples containing large amounts of reducing substances. Good
Linear in range 0.1–10 µg/mL. RSD at 5 µg/g 1.7 % (n=5).
(n=3) (n=3) (n=3) (n=3) (n=3) SD 0.65 µg/g
2.73±0.11 µg/g agreement achieved between both methods for other foods. 2.00±0.10 µg/g 25.9±0.10 µg/g 19.0±0.10 µg/g 15.0±0.15 µg/g (n=6) 4.1±0.3 µg/mL (n=6) 2.5±0.6 µg/mL (n=6) 3.4±0.7 µg/mL (n=6) 29.6±0.4 µg/mL (n=6) 18.7±0.7 µg/g
Cod roe Salmon roe Pork ham Fish sausage Meat sausage Linear calibration curve r = 0.9824 Detection limit 2.2 µg/mL for beer Apple juice Exotic juice Multivitamin juice Beer Tomatoes
Precision of method established and applied to real samples (n=5) Precision of method established and applied to real samples (n=5)
Meat and fish products Food (DPV)
Enzymic spectrometric Differential pulse voltammetry