
Page 292 - Analytical method for food addtives
P. 292
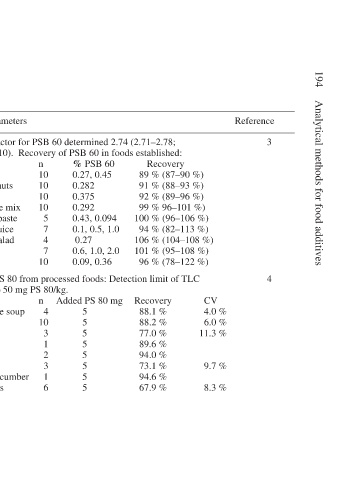
194  Analytical methods for food additives


                        Reference  3                 4     CV  4.0 %  6.0 %  11.3 %  9.7 %  8.3 %


                                     Recovery  89 % (87–90 %)  91 % (88–93 %)  92 % (89–96 %)  99 % 96–101 %)  100 % (96–106 %)  94 % (82–113 %)  106 % (104–108 %)  101 % (95–108 %)  96 % (78–122 %)  Recovery  88.1 %  88.2 %  77.0 %  89.6 %  94.0 %  73.1 %  %  94.6  67.9 %
                            Gravimetric factor for PSB 60 determined 2.74 (2.71–2.78;


                                % PSB 60  0.27, 0.45  0.282  0.375  0.292  0.43, 0.094  0.1, 0.5, 1.0   0.27  0.6, 1.0, 2.0  0.09, 0.36 Recovery of PS 80 from processed foods: Detection limit of TLC  n     Added PS 80 mg  5  5  5  5  5  5  5  5


                                n SD, 0.026, n=10).  Recovery of PSB 60 in foods established:  10  10  10  10  5  7  4  7  10  4  10  3  1  2  3  1  6
                        Statistical parameters  Food  Baked bread  Raised doughnuts  Baked cake  Chocolate cake mix  Dried tomato paste  Dried lemon juice  Dressing for salad  Shortening  Potato flakes  corresponds to 50 mg PS 80/kg.  Foodstuffs  Chinese noodle soup  Chocolate  Mayonnaise  Butter  Margarine  Peanut butter  Pickled dill cucumber  Sala


                    Summary of statistical parameters for polysorbates in foods


                        Extent of validation  Performance of method established and recovery checked with real samples  Performance of method established and recovery  for screening test determined by spiking PS-free processed foods


                        Matrix  Foods                Processed  foods


                    Table 17.2  Method  Gravimetric  Colorimetric  with  confirmation  by IR, TLC  and GC