Page 372 - Analytical method for food addtives
P. 372

252  Analytical methods for food additives


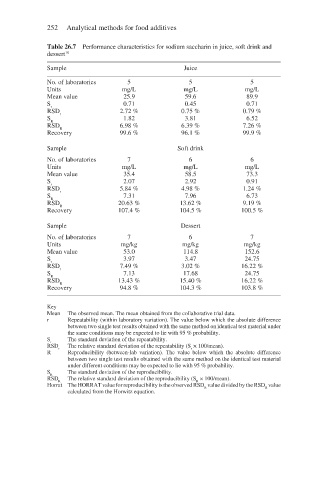
              Table 26.7  Performance characteristics for sodium saccharin in juice, soft drink and
              dessert 18
              Sample                                Juice

              No. of laboratories   5                5                5
              Units                mg/L             mg/L             mg/L
              Mean value           25.9             59.6             89.9
              S                    0.71             0.45             0.71
               r
              RSD                 2.72 %           0.75 %           0.79 %
                  r
              S                    1.82             3.81             6.52
               R
              RSD                 6.98 %           6.39 %           7.26 %
                  R
              Recovery            99.6 %           96.1 %           99.9 %
              Sample                              Soft drink
              No. of laboratories   7                6                6
              Units                mg/L             mg/L             mg/L
              Mean value           35.4             58.5             73.3
              S                    2.07             2.92             0.91
               r
              RSD                 5.84 %           4.98 %           1.24 %
                  r
              S                    7.31             7.96             6.73
               R
              RSD                 20.63 %          13.62 %          9.19 %
                  R
              Recovery            107.4 %          104.5 %          100.5 %
              Sample                               Dessert
              No. of laboratories   7                6                7
              Units               mg/kg            mg/kg            mg/kg
              Mean value           53.0             114.8            152.6
              S                    3.97             3.47             24.75
               r
              RSD                 7.49 %           3.02 %           16.22 %
                  r
              S                    7.13             17.68            24.75
               R
              RSD                 13.43 %          15.40 %          16.22 %
                  R
              Recovery            94.8 %           104.3 %          103.8 %
              Key
              Mean  The observed mean. The mean obtained from the collaborative trial data.
              r     Repeatability (within laboratory variation). The value below which the absolute difference
                    between two single test results obtained with the same method on identical test material under
                    the same conditions may be expected to lie with 95 % probability.
              S r   The standard deviation of the repeatability.
              RSD r  The relative standard deviation of the repeatability (S  × 100/mean).
                                                      r
              R     Reproducibility (between-lab variation). The value below which the absolute difference
                    between two single test results obtained with the same method on the identical test material
                    under different conditions may be expected to lie with 95 % probability.
              S R   The standard deviation of the reproducibility.
              RSD R  The relative standard deviation of the reproducibility (S  × 100/mean).
                                                       R
              Horrat The HORRAT value for reproducibility is the observed RSD  value divided by the RSD  value
                                                                          R
                                                          R
                    calculated from the Horwitz equation.
   367   368   369   370   371   372   373   374   375   376   377