
Page 367 - Analytical method for food addtives
P. 367
E954: Saccharin 247
10 9 2+ is 3 19 7
Results obtained for saccharin for six commercial products
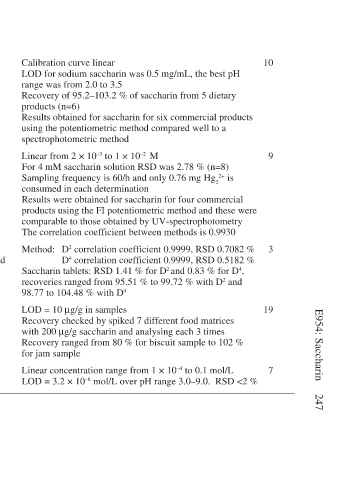
LOD for sodium saccharin was 0.5 mg/mL, the best pH
Recovery of 95.2–103.2 % of saccharin from 5 dietary
using the potentiometric method compared well to a
M mM saccharin solution RSD was 2.78 % (n=8) Sampling frequency is 60/h and only 0.76 mg Hg 2 Results were obtained for saccharin for four commercial products using the FI potentiometric method and these were comparable to those obtained by UV-spectrophotometry The correlation coefficient between methods is 0.9930 D 2 c
Calibration curve linear range was from 2.0 to 3.5 products (n=6) spectrophotometric method Linear from 2 × 10 –3 to 1 × 10 –2 For 4 consumed in each determination Method: 98.77 to 104.48 % with D 4 LOD = 10 µg/g in samples for jam sample
Precision of method established with standards (n=6) Precision of method established with standards (n=4) Precision of method established and applied to real samples Precision of method established Precision of method established
Dietary products Dietary products Artificial sweeteners Foods Aqueous solutions
Potentiometric Flow injection potentiometric Derivative UV spectrophotometric HPLC Ion-selective electrode