
Page 366 - Analytical method for food addtives
P. 366
7
19
Recovery ranged from 80 % for biscuit sample to 102 %
Recovery checked by spiked 7 different food matrices
Linear concentration range from 1 × 10 –4 to 0.1 mol/L
with 200 µg/g saccharin and analysing each 3 times
LOD = 10 µg/g in samples
for jam sample
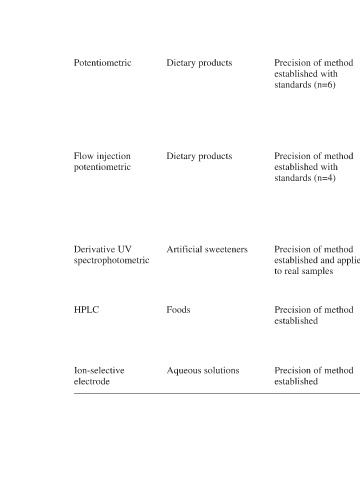
Precision of method 10 Calibration curve linear LOD for sodium saccharin was 0.5 mg/mL, the best pH established with range was from 2.0 to 3.5 standards (n=6) Recovery of 95.2–103.2 % of saccharin from 5 dietary products (n=6) Results obtained for saccharin for six commercial products using the potentiometric method compared well to a
Precision of method
Precision of method
established
Dietary products Dietary products Artificial sweeteners Foods Aqueous solutions
Potentiometric Flow injection potentiometric Derivative UV spectrophotometric HPLC Ion-selective electrode