
Page 371 - Analytical method for food addtives
P. 371
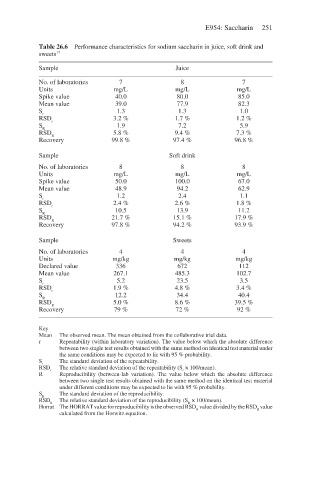
E954: Saccharin  251


            Table 26.6 Performance characteristics for sodium saccharin in juice, soft drink and
            sweets 17
            Sample                                Juice

            No. of laboratories   7                8                7
            Units               mg/L              mg/L             mg/L
            Spike value          40.0             80.0             85.0
            Mean value           39.0             77.9             82.3
            S                    1.3              1.3              1.0
             r
            RSD                 3.2 %            1.7 %            1.2 %
               r
            S                    1.9              7.2              5.9
             R
            RSD                 5.8 %            9.4 %            7.3 %
               R
            Recovery            99.8 %           97.4 %           96.8 %
            Sample                              Soft drink
            No. of laboratories   8                8                8
            Units               mg/L              mg/L             mg/L
            Spike value          50.0            100.0             67.0
            Mean value           48.9             94.2             62.9
            S                    1.2              2.4              1.1
             r
            RSD                 2.4 %            2.6 %            1.8 %
               r
            S                    10.5             13.9             11.2
             R
            RSD                 21.7 %           15.1 %           17.9 %
               R
            Recovery            97.8 %           94.2 %           93.9 %
            Sample                               Sweets
            No. of laboratories   4                4                4
            Units               mg/kg            mg/kg            mg/kg
            Declared value       336              672              112
            Mean value          267.1            485.3            102.7
            S                    5.2              23.5             3.5
             r
            RSD                 1.9 %            4.8 %            3.4 %
               r
            S                    12.2             34.4             40.4
             R
            RSD                 5.0 %            8.6 %            39.5 %
               R
            Recovery             79 %             72 %             92 %
            Key
            Mean  The observed mean. The mean obtained from the collaborative trial data.
            r    Repeatability (within laboratory variation). The value below which the absolute difference
                 between two single test results obtained with the same method on identical test material under
                 the same conditions may be expected to lie with 95 % probability.
            S r  The standard deviation of the repeatability.
            RSD r  The relative standard deviation of the repeatability (S  × 100/mean).
                                                    r
            R    Reproducibility (between-lab variation). The value below which the absolute difference
                 between two single test results obtained with the same method on the identical test material
                 under different conditions may be expected to lie with 95 % probability.
            S R  The standard deviation of the reproducibility.
            RSD R  The relative standard deviation of the reproducibility (S  × 100/mean).
                                                     R
            Horrat The HORRAT value for reproducibility is the observed RSD  value divided by the RSD  value
                                                                        R
                                                       R
                 calculated from the Horwitz equation.