Page 250 - Anatomy of a Robot
P. 250

09_200256_CH09/Bergren   4/17/03  11:24 AM  Page 235
                                                                             20
                                            -10   -5  0  0   5    10    15  Eb/No (dB) COMMUNICATIONS 235
                                                                                   25
                                                      -1
                                                      -2
                                              Shannon's
                                              Limit
                                              -1.6 dB  -3
                                                      -4
                                                      -5
                                                      -6
                                                  Log (BER)
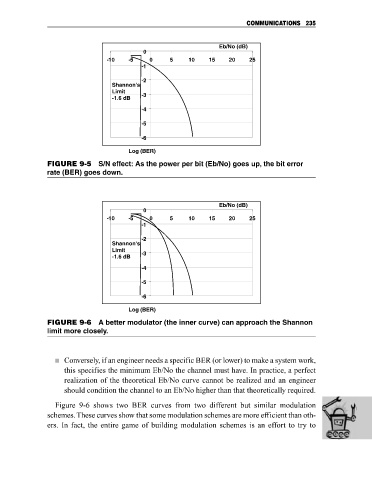
                            FIGURE 9-5 S/N effect: As the power per bit (Eb/No) goes up, the bit error
                            rate (BER) goes down.


                                                                           Eb/No (dB)
                                                      0
                                            -10   -5    0    5    10    15   20    25
                                                      -1
                                                      -2
                                              Shannon's
                                              Limit
                                              -1.6 dB  -3
                                                      -4
                                                      -5

                                                      -6
                                                  Log (BER)
                            FIGURE 9-6 A better modulator (the inner curve) can approach the Shannon
                            limit more closely.


                                Conversely, if an engineer needs a specific BER (or lower) to make a system work,
                                 this specifies the minimum Eb/No the channel must have. In practice, a perfect
                                 realization of the theoretical Eb/No curve cannot be realized and an engineer
                                 should condition the channel to an Eb/No higher than that theoretically required.

                              Figure  9-6  shows  two  BER  curves  from  two  different  but  similar  modulation
                            schemes. These curves show that some modulation schemes are more efficient than oth-
                            ers. In fact, the entire game of building modulation schemes is an effort to try to
   245   246   247   248   249   250   251   252   253   254   255