
Page 334 - Anthropometry, Apparel Sizing and Design
P. 334
Foot morphological between ethnic groups 327
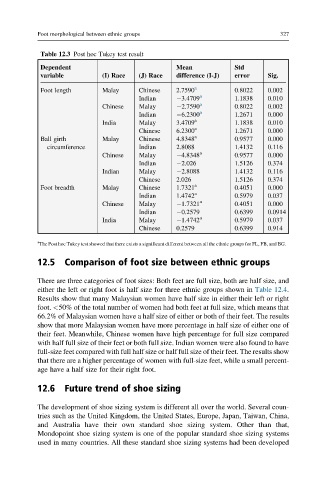
Table 12.3 Post hoc Tukey test result
Dependent Mean Std
variable (I) Race (J) Race difference (I-J) error Sig.
Foot length Malay Chinese 2.7590 a 0.8022 0.002
Indian 3.4709 a 1.1838 0.010
Chinese Malay 2.7590 a 0.8022 0.002
Indian 6.2300 a 1.2671 0.000
India Malay 3.4709 a 1.1838 0.010
Chinese 6.2300 a 1.2671 0.000
Ball girth Malay Chinese 4.8348 a 0.9577 0.000
circumference Indian 2.8088 1.4132 0.116
Chinese Malay 4.8348 a 0.9577 0.000
Indian 2.026 1.5126 0.374
Indian Malay 2.8088 1.4132 0.116
Chinese 2.026 1.5126 0.374
Foot breadth Malay Chinese 1.7321 a 0.4051 0.000
Indian 1.4742 a 0.5979 0.037
Chinese Malay 1.7321 a 0.4051 0.000
Indian 0.2579 0.6399 0.0914
India Malay 1.4742 a 0.5979 0.037
Chinese 0.2579 0.6399 0.914
a
The Post hoc Tukey test showed that there exists a significant different between all the ethnic groups for FL, FB, and BG.
12.5 Comparison of foot size between ethnic groups
There are three categories of foot sizes: Both feet are full size, both are half size, and
either the left or right foot is half size for three ethnic groups shown in Table 12.4.
Results show that many Malaysian women have half size in either their left or right
foot. <50% of the total number of women had both feet at full size, which means that
66.2% of Malaysian women have a half size of either or both of their feet. The results
show that more Malaysian women have more percentage in half size of either one of
their feet. Meanwhile, Chinese women have high percentage for full size compared
with half full size of their feet or both full size. Indian women were also found to have
full-size feet compared with full half size or half full size of their feet. The results show
that there are a higher percentage of women with full-size feet, while a small percent-
age have a half size for their right foot.
12.6 Future trend of shoe sizing
The development of shoe sizing system is different all over the world. Several coun-
tries such as the United Kingdom, the United States, Europe, Japan, Taiwan, China,
and Australia have their own standard shoe sizing system. Other than that,
Mondopoint shoe sizing system is one of the popular standard shoe sizing systems
used in many countries. All these standard shoe sizing systems had been developed