
Page 333 - Anthropometry, Apparel Sizing and Design
P. 333
326 Anthropometry, Apparel Sizing and Design
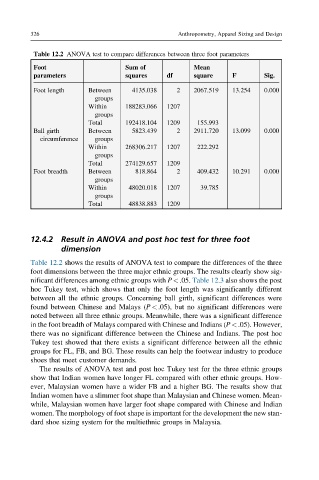
Table 12.2 ANOVA test to compare differences between three foot parameters
Foot Sum of Mean
parameters squares df square F Sig.
Foot length Between 4135.038 2 2067.519 13.254 0.000
groups
Within 188283.066 1207
groups
Total 192418.104 1209 155.993
Ball girth Between 5823.439 2 2911.720 13.099 0.000
circumference groups
Within 268306.217 1207 222.292
groups
Total 274129.657 1209
Foot breadth Between 818.864 2 409.432 10.291 0.000
groups
Within 48020.018 1207 39.785
groups
Total 48838.883 1209
12.4.2 Result in ANOVA and post hoc test for three foot
dimension
Table 12.2 shows the results of ANOVA test to compare the differences of the three
foot dimensions between the three major ethnic groups. The results clearly show sig-
nificant differences among ethnic groups with P<.05. Table 12.3 also shows the post
hoc Tukey test, which shows that only the foot length was significantly different
between all the ethnic groups. Concerning ball girth, significant differences were
found between Chinese and Malays (P<.05), but no significant differences were
noted between all three ethnic groups. Meanwhile, there was a significant difference
in the foot breadth of Malays compared with Chinese and Indians (P<.05). However,
there was no significant difference between the Chinese and Indians. The post hoc
Tukey test showed that there exists a significant difference between all the ethnic
groups for FL, FB, and BG. These results can help the footwear industry to produce
shoes that meet customer demands.
The results of ANOVA test and post hoc Tukey test for the three ethnic groups
show that Indian women have longer FL compared with other ethnic groups. How-
ever, Malaysian women have a wider FB and a higher BG. The results show that
Indian women have a slimmer foot shape than Malaysian and Chinese women. Mean-
while, Malaysian women have larger foot shape compared with Chinese and Indian
women. The morphology of foot shape is important for the development the new stan-
dard shoe sizing system for the multiethnic groups in Malaysia.