
Page 232 -
P. 232
194 Part III Underbalanced Drilling Systems
9.3 THE GAS–LIQUID FLOW RATE WINDOW
For a given hole geometry (hole and pipe sizes and depth) and fluid
properties, the surface choke pressure, liquid flow rate, and gas injection
rate are three major parameters that affect bottomhole pressures. The
liquid flow rate and gas injection rate should be carefully designed to
ensure underbalanced drilling and wellbore integrity. The gas‒liquid flow
rate window (GLRW) described in this section defines the margins of
useable liquid and gas flow rates in underbalanced drilling.
The concept of GLRW was first defined by Guo and Ghalambor
(2002). The combination of liquid flow rate and gas injection rate
should be carefully designed so the flowing bottomhole pressure is less
than the formation pore pressure under drilling conditions and the
circulation-break bottomhole pressure is greater than the formation
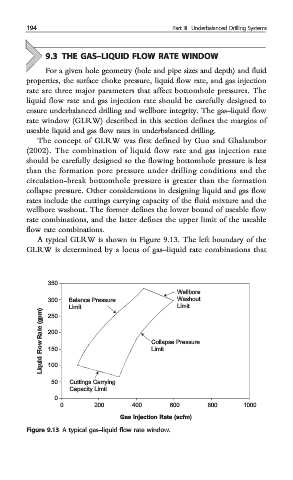
collapse pressure. Other considerations in designing liquid and gas flow
rates include the cuttings carrying capacity of the fluid mixture and the
wellbore washout. The former defines the lower bound of useable flow
rate combinations, and the latter defines the upper limit of the useable
flow rate combinations.
A typical GLRW is shown in Figure 9.13. The left boundary of the
GLRW is determined by a locus of gas‒liquid rate combinations that
350
Wellbore
300 Balance Pressure Washout
Limit
Limit
Liquid Flow Rate (gpm) 200 Collapse Pressure
250
150
Limit
100
50 Cuttings Carrying
Capacity Limit
0
0 200 400 600 800 1000
Gas Injection Rate (scfm)
Figure 9.13 A typical gas‒liquid flow rate window.