
Page 234 -
P. 234
196 Part III Underbalanced Drilling Systems
• The pressure differential should be low enough to ensure that
separators and storage facilities can handle the formation fluid influx
rate and the total fluid volume.
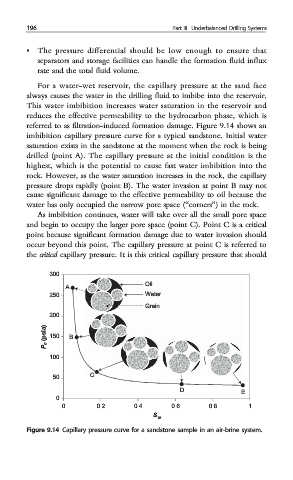
For a water-wet reservoir, the capillary pressure at the sand face
always causes the water in the drilling fluid to imbibe into the reservoir.
This water imbibition increases water saturation in the reservoir and
reduces the effective permeability to the hydrocarbon phase, which is
referred to as filtration-induced formation damage. Figure 9.14 shows an
imbibition capillary pressure curve for a typical sandstone. Initial water
saturation exists in the sandstone at the moment when the rock is being
drilled (point A). The capillary pressure at the initial condition is the
highest, which is the potential to cause fast water imbibition into the
rock. However, as the water saturation increases in the rock, the capillary
pressure drops rapidly (point B). The water invasion at point B may not
cause significant damage to the effective permeability to oil because the
water has only occupied the narrow pore space (“corners”) in the rock.
As imbibition continues, water will take over all the small pore space
and begin to occupy the larger pore space (point C). Point C is a critical
point because significant formation damage due to water invasion should
occur beyond this point. The capillary pressure at point C is referred to
the critical capillary pressure. It is this critical capillary pressure that should
300
Oil
A
250 Water
Grain
200
P c (psia) 150 B
100
C
50
D E
0
0 0.2 0.4 0.6 0.8 1
S w
Figure 9.14 Capillary pressure curve for a sandstone sample in an air-brine system.