Page 227 -
P. 227

Gas and Liquid Injection Rates                                189
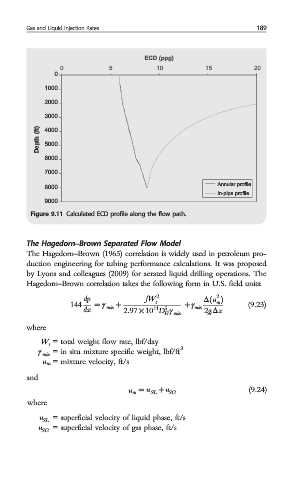


                                        ECD (ppg)
                 0            5            10           15           20
                0

             1000
             2000
             3000
           Depth (ft)  4000

             5000
             6000

             7000
                                                            Annular profile
             8000
                                                            In-pipe profile
             9000
         Figure 9.11 Calculated ECD profile along the flow path.


        The Hagedorn‒Brown Separated Flow Model
        The Hagedorn‒Brown (1965) correlation is widely used in petroleum pro-
        duction engineering for tubing performance calculations. It was proposed
        by Lyons and colleagues (2009) for aerated liquid drilling operations. The
        Hagedorn‒Brown correlation takes the following form in U.S. field units:

                                           2               2
                        dp              fW t            Δðu Þ
                                                           m
                    144   = γ mix +                + γ mix          (9.23)
                                          11
                                             5
                       dz         2:97 × 10 D γ         2g c Δz
                                             H mix
        where
            W t = total weight flow rate, lbf/day
           γ mix  = in situ mixture specific weight, lbf/ft 3
            u m = mixture velocity, ft/s
        and
                                                                    (9.24)
                                    u m = u SL + u SG
        where
           u SL = superficial velocity of liquid phase, ft/s
           u SG = superficial velocity of gas phase, ft/s
   222   223   224   225   226   227   228   229   230   231   232