Page 226 -
P. 226

188                                    Part III Underbalanced Drilling Systems


          Illustrative Example 9.2 (Continued )
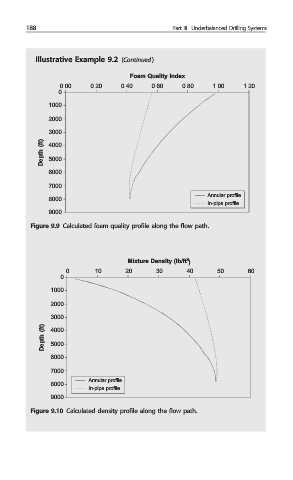
                                    Foam Quality Index
                 0.00    0.20     0.40    0.60    0.80    1.00     1.20
                 0
              1000

              2000
              3000
            Depth (ft)  4000
              5000

              6000
              7000
                                                         Annular profile
              8000
                                                         In-pipe profile
              9000
         Figure 9.9 Calculated foam quality profile along the flow path.


                                                   3
                                   Mixture Density (Ib/ft )
                   0      10       20      30      40      50       60
                 0
              1000
              2000
              3000
             Depth (ft)  4000

              5000
              6000
              7000
                         Annular profile
              8000
                         In-pipe profile
              9000
         Figure 9.10 Calculated density profile along the flow path.
   221   222   223   224   225   226   227   228   229   230   231