
Page 225 -
P. 225
Gas and Liquid Injection Rates 187
Pressure (psia)
0 500 1000 1500 2000 2500 3000 3500
0
1000
2000
3000
Depth (ft) 4000
5000
6000
7000
Annular profile
8000
In-pipe profile
9000
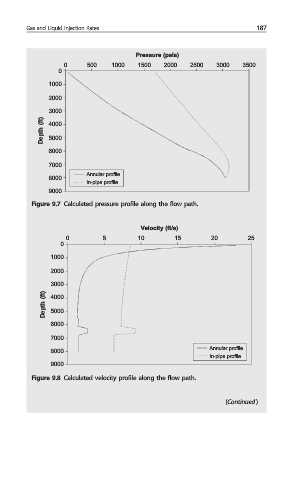
Figure 9.7 Calculated pressure profile along the flow path.
Velocity (ft/s)
0 5 10 15 20 25
0
1000
2000
3000
Depth (ft) 4000
5000
6000
7000
Annular profile
8000
In-pipe profile
9000
Figure 9.8 Calculated velocity profile along the flow path.
(Continued )