Page 220 -
P. 220

182                                    Part III Underbalanced Drilling Systems


          Illustrative Example 9.1 (Continued )
                                       Velocity (ft/s)
                   0       5       10      15      20       25      30
                 0
               1000

               2000
               3000
             Depth (ft)  4000                            Annular profile

                                                         In-pipe profile
               5000
               6000
               7000
               8000
               9000

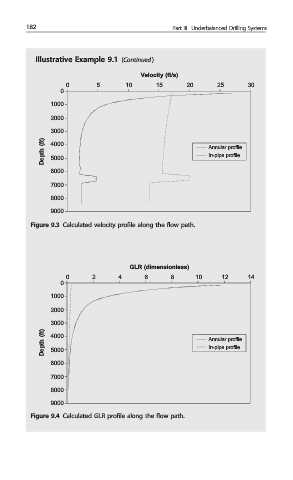
         Figure 9.3 Calculated velocity profile along the flow path.


                                    GLR (dimensionless)
                   0      2      4      6      8      10     12     14
                 0

              1000
              2000
              3000
             Depth (ft)  4000                            Annular profile
                                                         In-pipe profile
              5000
              6000
              7000
              8000

              9000
         Figure 9.4 Calculated GLR profile along the flow path.
   215   216   217   218   219   220   221   222   223   224   225