
Page 100 - Applied Petroleum Geomechanics
P. 100
92 Applied Petroleum Geomechanics
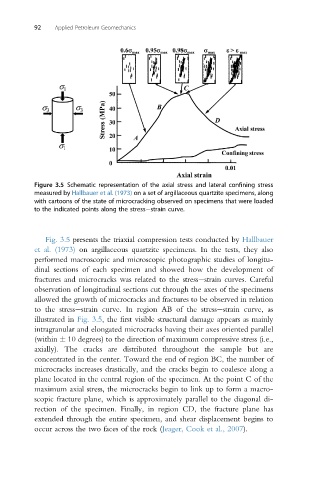
Figure 3.5 Schematic representation of the axial stress and lateral confining stress
measured by Hallbauer et al. (1973) on a set of argillaceous quartzite specimens, along
with cartoons of the state of microcracking observed on specimens that were loaded
to the indicated points along the stressestrain curve.
Fig. 3.5 presents the triaxial compression tests conducted by Hallbauer
et al. (1973) on argillaceous quartzite specimens. In the tests, they also
performed macroscopic and microscopic photographic studies of longitu-
dinal sections of each specimen and showed how the development of
fractures and microcracks was related to the stressestrain curves. Careful
observation of longitudinal sections cut through the axes of the specimens
allowed the growth of microcracks and fractures to be observed in relation
to the stressestrain curve. In region AB of the stressestrain curve, as
illustrated in Fig. 3.5, the first visible structural damage appears as mainly
intragranular and elongated microcracks having their axes oriented parallel
(within 10 degrees) to the direction of maximum compressive stress (i.e.,
axially). The cracks are distributed throughout the sample but are
concentrated in the center. Toward the end of region BC, the number of
microcracks increases drastically, and the cracks begin to coalesce along a
plane located in the central region of the specimen. At the point C of the
maximum axial stress, the microcracks begin to link up to form a macro-
scopic fracture plane, which is approximately parallel to the diagonal di-
rection of the specimen. Finally, in region CD, the fracture plane has
extended through the entire specimen, and shear displacement begins to
occur across the two faces of the rock (Jeager, Cook et al., 2007).