
Page 105 - Applied Petroleum Geomechanics
P. 105
Rock strengths and rock failure criteria 97
UCS (MPa)
0 10 20 30 40 50 60 70 80 90
0
500
1000
1500
2000 UCS
Depth (m) 2500 from Lal UCS DT
3000
3500 from Horsrud
4000
4500
5000
0 20 40 60 80 100 120 140 160
DT (us/ft)
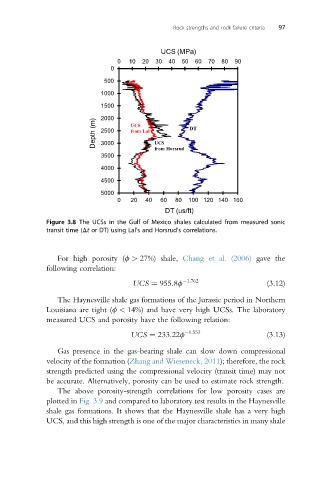
Figure 3.8 The UCSs in the Gulf of Mexico shales calculated from measured sonic
transit time (Dt or DT) using Lal’s and Horsrud’s correlations.
For high porosity (f > 27%) shale, Chang et al. (2006) gave the
following correlation:
UCS ¼ 955:8f 1:762 (3.12)
The Haynesville shale gas formations of the Jurassic period in Northern
Louisiana are tight (f < 14%) and have very high UCSs. The laboratory
measured UCS and porosity have the following relation:
UCS ¼ 233:22f 0:553 (3.13)
Gas presence in the gas-bearing shale can slow down compressional
velocity of the formation (Zhang and Wieseneck, 2011); therefore, the rock
strength predicted using the compressional velocity (transit time) may not
be accurate. Alternatively, porosity can be used to estimate rock strength.
The above porosity-strength correlations for low porosity cases are
plotted in Fig. 3.9 and compared to laboratory test results in the Haynesville
shale gas formations. It shows that the Haynesville shale has a very high
UCS, and this high strength is one of the major characteristics in many shale