
Page 106 - Applied Petroleum Geomechanics
P. 106
98 Applied Petroleum Geomechanics
250
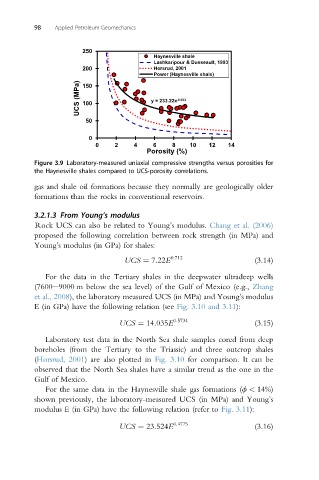
Haynesville shale
Lashkaripour & Dusseault, 1993
200 Horsrud, 2001
Power (Haynesville shale)
UCS (MPa) 100 y = 233.22x -0.553
150
50
0
0 2 4 6 8 10 12 14
Porosity (%)
Figure 3.9 Laboratory-measured uniaxial compressive strengths versus porosities for
the Haynesville shales compared to UCS-porosity correlations.
gas and shale oil formations because they normally are geologically older
formations than the rocks in conventional reservoirs.
3.2.1.3 From Young’s modulus
Rock UCS can also be related to Young’s modulus. Chang et al. (2006)
proposed the following correlation between rock strength (in MPa) and
Young’s modulus (in GPa) for shales:
UCS ¼ 7:22E 0:712 (3.14)
For the data in the Tertiary shales in the deepwater ultradeep wells
(7600e9000 m below the sea level) of the Gulf of Mexico (e.g., Zhang
et al., 2008), the laboratory measured UCS (in MPa) and Young’s modulus
E (in GPa) have the following relation (see Fig. 3.10 and 3.11):
UCS ¼ 14:035E 0:5734 (3.15)
Laboratory test data in the North Sea shale samples cored from deep
boreholes (from the Tertiary to the Triassic) and three outcrop shales
(Horsrud, 2001) are also plotted in Fig. 3.10 for comparison. It can be
observed that the North Sea shales have a similar trend as the one in the
Gulf of Mexico.
For the same data in the Haynesville shale gas formations (f < 14%)
shown previously, the laboratory-measured UCS (in MPa) and Young’s
modulus E (in GPa) have the following relation (refer to Fig. 3.11):
UCS ¼ 23:524E 0:4775 (3.16)