
Page 107 - Applied Petroleum Geomechanics
P. 107
Rock strengths and rock failure criteria 99
90
80
70
60
UCS (MPa) 50 y = 14.035x 0.5734
40
R² = 0.7869
30
20 Data: Horsrud, 2001
GoM shale
10 Power (GoM shale)
0
0 5 10 15 20
E (GPa)
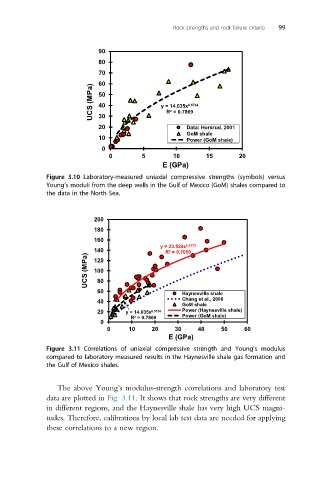
Figure 3.10 Laboratory-measured uniaxial compressive strengths (symbols) versus
Young’s moduli from the deep wells in the Gulf of Mexico (GoM) shales compared to
the data in the North Sea.
200
180
160
140 y = 23.524x 0.4775
R² = 0.7059
UCS (MPa) 100
120
80
60 Haynesville shale
40 Chang et al., 2006
GoM shale
20 y = 14.035x 0.5734 Power (Haynesville shale)
R² = 0.7869 Power (GoM shale)
0
0 10 20 30 40 50 60
E (GPa)
Figure 3.11 Correlations of uniaxial compressive strength and Young’s modulus
compared to laboratory measured results in the Haynesville shale gas formation and
the Gulf of Mexico shales.
The above Young’s modulus-strength correlations and laboratory test
data are plotted in Fig. 3.11. It shows that rock strengths are very different
in different regions, and the Haynesville shale has very high UCS magni-
tudes. Therefore, calibrations by local lab test data are needed for applying
these correlations to a new region.