
Page 110 - Applied Petroleum Geomechanics
P. 110
102 Applied Petroleum Geomechanics
3
where UCS is in MPa, bulk density r is in g/cm , and V p is in km/s. Note
that Eq. (3.20) is different from their original equation because a different
unit is used here.
For very strong and consolidated sandstones in Australia
(0.05 < f < 0.12 and UCS > 80 MPa), the following empirical equation
was developed (Chang et al., 2006):
UCS ¼ 42:1 exp 1:9 10 rV p 2 (3.21)
2
3
where UCS is in MPa, bulk density r is in g/cm , and V p is in km/s.
The above correlations (equations) were obtained either from limited data
or from the datasets in local conditions. For applications to a new area, cali-
bration is extremely important before using any of these strength correlations.
3.2.2.2 From Young’s modulus and porosity
Based on the data presented by Plumb (1994), Bradford et al. (1998) used
the following correlation between the UCS and Young’s modulus for weak
reservoir sandstones with risks of sand production:
UCS ¼ 2:28 þ 4:1089E (3.22)
where UCS is in MPa and E is in GPa.
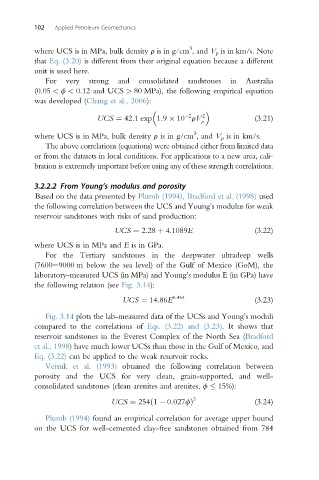
For the Tertiary sandstones in the deepwater ultradeep wells
(7600e9000 m below the sea level) of the Gulf of Mexico (GoM), the
laboratory-measured UCS (in MPa) and Young’s modulus E (in GPa) have
the following relation (see Fig. 3.14):
UCS ¼ 14:86E 0:464 (3.23)
Fig. 3.14 plots the lab-measured data of the UCSs and Young’s moduli
compared to the correlations of Eqs. (3.22) and (3.23). It shows that
reservoir sandstones in the Everest Complex of the North Sea (Bradford
et al., 1998) have much lower UCSs than those in the Gulf of Mexico, and
Eq. (3.22) can be applied to the weak reservoir rocks.
Vernik et al. (1993) obtained the following correlation between
porosity and the UCS for very clean, grain-supported, and well-
consolidated sandstones (clean arenites and arenites, f 15%):
2
UCS ¼ 254ð1 0:027fÞ (3.24)
Plumb (1994) found an empirical correlation for average upper bound
on the UCS for well-cemented clay-free sandstones obtained from 784