
Page 109 - Applied Petroleum Geomechanics
P. 109
Rock strengths and rock failure criteria 101
Rock strength UCS (MPa)
0 10 20 30 40 50 60 70 80 90 100
8500
Weak sand correlation
8550
Core - sandstone
Core - shale
8600
Core -mixed sandstone/shale
Depth (m TVD KB) 8700
8650
8750
8800
8850
8900
8950
9000
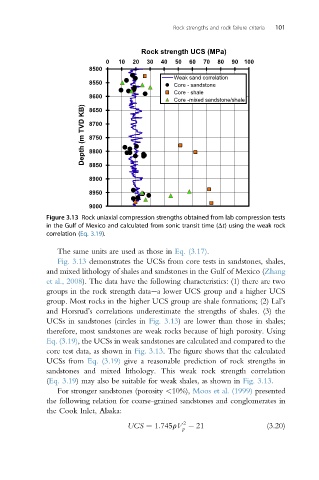
Figure 3.13 Rock uniaxial compression strengths obtained from lab compression tests
in the Gulf of Mexico and calculated from sonic transit time (Dt) using the weak rock
correlation (Eq. 3.19).
The same units are used as those in Eq. (3.17).
Fig. 3.13 demonstrates the UCSs from core tests in sandstones, shales,
and mixed lithology of shales and sandstones in the Gulf of Mexico (Zhang
et al., 2008). The data have the following characteristics: (1) there are two
groups in the rock strength dataea lower UCS group and a higher UCS
group. Most rocks in the higher UCS group are shale formations; (2) Lal’s
and Horsrud’s correlations underestimate the strengths of shales. (3) the
UCSs in sandstones (circles in Fig. 3.13) are lower than those in shales;
therefore, most sandstones are weak rocks because of high porosity. Using
Eq. (3.19), the UCSs in weak sandstones are calculated and compared to the
core test data, as shown in Fig. 3.13. The figure shows that the calculated
UCSs from Eq. (3.19) give a reasonable prediction of rock strengths in
sandstones and mixed lithology. This weak rock strength correlation
(Eq. 3.19) may also be suitable for weak shales, as shown in Fig. 3.13.
For stronger sandstones (porosity <10%), Moos et al. (1999) presented
the following relation for coarse-grained sandstones and conglomerates in
the Cook Inlet, Alaska:
2
UCS ¼ 1:745rV 21 (3.20)
p