
Page 187 - Applied Petroleum Geomechanics
P. 187
In situ stress regimes with lithology-dependent and depletion effects 181
constrained conditions than unconstrained conditions. The stress path order
is as uniaxial strain > generalized plane strain > plane strain > uncon-
strained. In their experiments a permanent stress change was also observed
during the production and injection cycle for all boundary conditions. This
indicates that most of stress changes during production are irrecoverable on
repressurization. Therefore, decreasing depletion or slowing down pro-
duction may reduce the irrecoverable reservoir damage.
5.5.2 Depletion and Mohr’s circle representation
The Mohr circle plots are useful for representing the depletion effect on the
reservoir rock and for demonstrating how stress changes in the reservoir
during its production history. As described in the previous section, the
minimum horizontal stress decreases as the reservoir depletion increases.
However, the vertical stress (overburden stress) does not change much
(e.g., Segall and Fitzgerald, 1998); therefore, vertical effective stress increases
as the depletion increases. Thus, a large stress difference in the effective
vertical and minimum effective horizontal stresses is created as depletion
increases, and the Mohr circle becomes larger. Fig. 5.13 presents the Mohr
circles and the relationship of the minimum effective horizontal stress,
effective vertical stress, shear stress, and the failure envelope for different
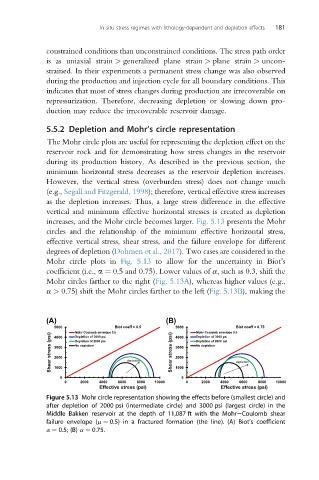
degrees of depletion (Dohmen et al., 2017). Two cases are considered in the
Mohr circle plots in Fig. 5.13 to allow for the uncertainty in Biot’s
coefficient (i.e., a ¼ 0.5 and 0.75). Lower values of a, such as 0.3, shift the
Mohr circles farther to the right (Fig. 5.13A), whereas higher values (e.g.,
a > 0.75) shift the Mohr circles farther to the left (Fig. 5.13B), making the
(A) (B)
5000 Biot coeff = 0.5 5000 Biot coeff = 0.75
Mohr-Coulomb envelope 0.5 4000 Mohr-Coulomb envelope 0.5
Shear stress (psi) 3000 No depletion deple on Shear stress (psi) 3000 No depletion deple on
4000
Depletion of 3000 psi
Depletion of 3000 psi
Depletion of 2000 psi
Depletion of 2000 psi
2000
2000
1000
0 1000 0
0 2000 4000 6000 8000 10000 0 2000 4000 6000 8000 10000
Effective stress (psi) Effective stress (psi)
Figure 5.13 Mohr circle representation showing the effects before (smallest circle) and
after depletion of 2000 psi (intermediate circle) and 3000 psi (largest circle) in the
Middle Bakken reservoir at the depth of 11,087 ft with the MohreCoulomb shear
failure envelope (m ¼ 0.5) in a fractured formation (the line). (A) Biot’s coefficient
a ¼ 0.5; (B) a ¼ 0.75.