
Page 182 - Applied Petroleum Geomechanics
P. 182
176 Applied Petroleum Geomechanics
where s x_tect is the tectonic stress, an additional stress, applied in one of the
horizontal directions, i.e., x-direction; ε x and ε y are the horizontal strains in
x and y directions caused by tectonic stresses, respectively.
Eq. (5.19) shows that the formation with a higher Young’s modulus
(e.g., a sandstone) has a higher tectonic stress, if the tectonic strains are the
same. Therefore, the sandstone may become a high stress interval in a strong
tectonic stress (strain) region. This may create a dilemma on where and how
to perforate the formations for hydraulic fracturing if based on conventional
practice (Yuan et al., 2013).
5.4 Fault strength and in situ stresses
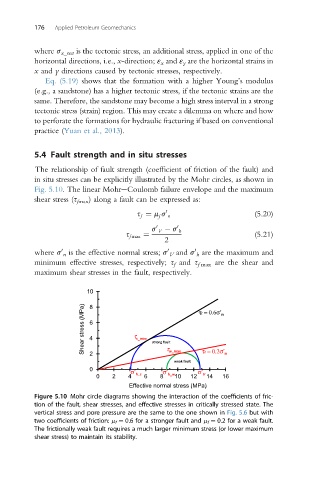
The relationship of fault strength (coefficient of friction of the fault) and
in situ stresses can be explicitly illustrated by the Mohr circles, as shown in
Fig. 5.10. The linear MohreCoulomb failure envelope and the maximum
shear stress (s fmax ) along a fault can be expressed as:
0
s f ¼ m s n (5.20)
f
0 0
s V s h
s f max ¼ (5.21)
2
0
0
where s n is the effective normal stress; s V and s h are the maximum and
0
minimum effective stresses, respectively; s f and s f max are the shear and
maximum shear stresses in the fault, respectively.
10
Shear stress (MPa) 6 τ s_max strong fault τ τf = 0.6σ′ n
8
4
τ w_max
2
weak fault τf = 0.2σ′ n
0
0 2 4 σ′ h_s 6 8 σ′ h_w 10 12 σ′ V 14 16
Effective normal stress (MPa)
Figure 5.10 Mohr circle diagrams showing the interaction of the coefficients of fric-
tion of the fault, shear stresses, and effective stresses in critically stressed state. The
vertical stress and pore pressure are the same to the one shown in Fig. 5.6 but with
two coefficients of friction: m f ¼ 0.6 for a stronger fault and m f ¼ 0.2 for a weak fault.
The frictionally weak fault requires a much larger minimum stress (or lower maximum
shear stress) to maintain its stability.