
Page 177 - Applied Petroleum Geomechanics
P. 177
In situ stress regimes with lithology-dependent and depletion effects 171
6000
Measured stress
6100 Possible stress
sandstone
6200
Depth (ft) 6300 sandstone
6400
6500 shale
sandstone
shale
6600
sandstone
6700 shale
6800
3000 3500 4000 4500 5000 5500 6000
Minimum in-situ stress (psi)
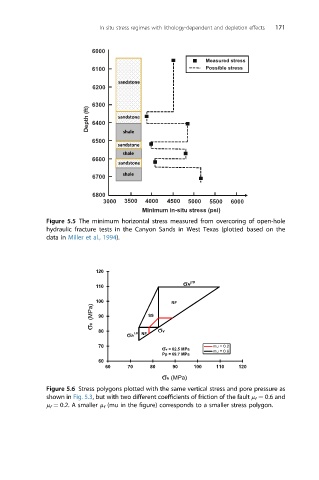
Figure 5.5 The minimum horizontal stress measured from overcoring of open-hole
hydraulic fracture tests in the Canyon Sands in West Texas (plotted based on the
data in Miller et al., 1994).
120
110
100 RF
(MPa) 90 SS
σH
80 σv
NF
70 mu = 0.2
σ σv = 82.5 MPa mu = 0.6
Pp = 69.7 MPa
60
60 70 80 90 100 110 120
σh (MPa)
Figure 5.6 Stress polygons plotted with the same vertical stress and pore pressure as
shown in Fig. 5.3, but with two different coefficients of friction of the fault m f ¼ 0.6 and
m f ¼ 0.2. A smaller m f (mu in the figure) corresponds to a smaller stress polygon.