
Page 173 - Applied Petroleum Geomechanics
P. 173
In situ stress regimes with lithology-dependent and depletion effects 167
UB
From Eq. (5.10), the upper bound maximum horizontal stress (s ) can
H
be expressed as:
2
q ffiffiffiffiffiffiffiffiffiffiffiffiffi
UB 2
s H ¼ m þ 1 þ m f ðs V ap p Þþ ap p (5.12)
f
It should be noted that Biot’s effective stress coefficient, a, approaches 1
when the rocks are near the state of failures. Therefore, it can be assumed
that a ¼ 1in Eqs. (5.8)e(5.12).
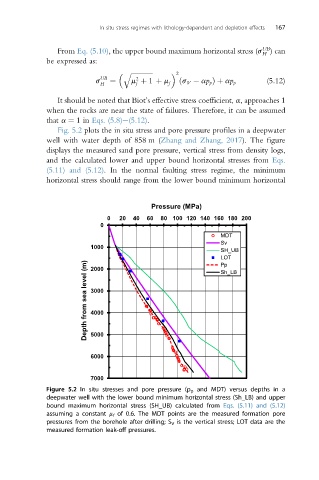
Fig. 5.2 plots the in situ stress and pore pressure profiles in a deepwater
well with water depth of 858 m (Zhang and Zhang, 2017). The figure
displays the measured sand pore pressure, vertical stress from density logs,
and the calculated lower and upper bound horizontal stresses from Eqs.
(5.11) and (5.12). In the normal faulting stress regime, the minimum
horizontal stress should range from the lower bound minimum horizontal
Pressure (MPa)
0 20 40 60 80 100 120 140 160 180 200
0
MDT
Sv
1000
SH_UB
LOT
Depth from sea level (m) 3000
Pp
2000
Sh_LB
4000
5000
6000
7000
Figure 5.2 In situ stresses and pore pressure (p p and MDT) versus depths in a
deepwater well with the lower bound minimum horizontal stress (Sh_LB) and upper
bound maximum horizontal stress (SH_UB) calculated from Eqs. (5.11) and (5.12)
assuming a constant m f of 0.6. The MDT points are the measured formation pore
pressures from the borehole after drilling; S V is the vertical stress; LOT data are the
measured formation leak-off pressures.