
Page 180 - Applied Petroleum Geomechanics
P. 180
174 Applied Petroleum Geomechanics
the Central North Sea, Goulty and Swarbrick (2005) estimated that the slip
on fault surfaces is consistent with m f ¼ 0.11 0.02.
Therefore, the common assumption of a fault strength of m f ¼ 0.6 e 0.7
would only correspond to a low Poisson’s ratio rock (e.g., sandstone,
limestone). For shales and other ductile rocks, m f values should be lower
from Eq. (5.18). Therefore, the strength or the coefficient of friction of the
fault may not be as large as that previously assumed (i.e., m f ¼ 0.6 e 0.7). It
should be smaller (e.g., as small as m f ¼ 0.1 e 0.2) in shales or mudstones.
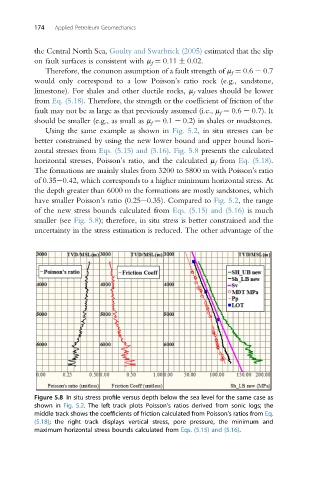
Using the same example as shown in Fig. 5.2, in situ stresses can be
better constrained by using the new lower bound and upper bound hori-
zontal stresses from Eqs. (5.15) and (5.16). Fig. 5.8 presents the calculated
horizontal stresses, Poisson’s ratio, and the calculated m f from Eq. (5.18).
The formations are mainly shales from 3200 to 5800 m with Poisson’s ratio
of 0.35e0.42, which corresponds to a higher minimum horizontal stress. At
the depth greater than 6000 m the formations are mostly sandstones, which
have smaller Poisson’s ratio (0.25e0.35). Compared to Fig. 5.2, the range
of the new stress bounds calculated from Eqs. (5.15) and (5.16) is much
smaller (see Fig. 5.8); therefore, in situ stress is better constrained and the
uncertainty in the stress estimation is reduced. The other advantage of the
Figure 5.8 In situ stress profile versus depth below the sea level for the same case as
shown in Fig. 5.2. The left track plots Poisson’s ratios derived from sonic logs; the
middle track shows the coefficients of friction calculated from Poisson’s ratios from Eq.
(5.18); the right track displays vertical stress, pore pressure, the minimum and
maximum horizontal stress bounds calculated from Eqs. (5.15) and (5.16).