
Page 202 - Applied Petroleum Geomechanics
P. 202
In situ stress estimate 197
into the formation interval, the value of stress will increase because of the
additional stresses created by the presence of this extra fluid, and this could
distort the results.
By examining the pressure falloff data after several injection periods, the
point at which the fracture closes can be observed, and closure pressure can
be better estimated (Whitehead et al., 1986). When the pump is shut in, the
pressure decline behavior should represent linear flow of fluid from the
fracture into the reservoir (Jones and Sargeant, 1993). During infinite-
conductivity fracture flow, pressure in the wellbore varies as described by
the following equation:
Dp ¼ At 1=2 (6.19)
A similar relation exists for finite-conductivity fracture flow:
0 1=4
Dp ¼ A t (6.20)
where Dp is the difference between the final injection pressure and shut-in
bottomhole pressure; t is the elapsed time; A and A are constants.
0
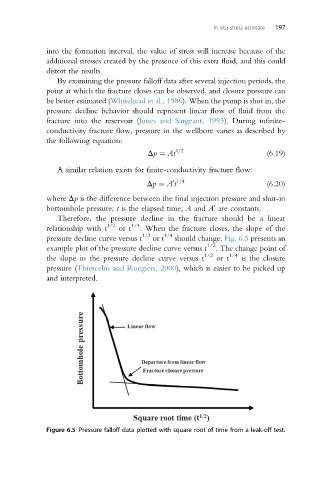
Therefore, the pressure decline in the fracture should be a linear
relationship with t 1/2 or t 1/4 . When the fracture closes, the slope of the
1/2 1/4
pressure decline curve versus t or t should change. Fig. 6.5 presents an
example plot of the pressure decline curve versus t 1/2 . The change point of
the slope in the pressure decline curve versus t 1/2 or t 1/4 is the closure
pressure (Thiercelin and Roegiers, 2000), which is easier to be picked up
and interpreted.
Figure 6.5 Pressure falloff data plotted with square root of time from a leak-off test.