
Page 207 - Applied Petroleum Geomechanics
P. 207
202 Applied Petroleum Geomechanics
Stress/pressure (psi)
0 2000 4000 6000 8000 10000
5000
5500
6000
6500
7000
Depth (ft) 7500
8000
8500
9000
Pore pressure
9500 Sh measured
Sh calculated
10000 Hydrostatic Pp
OBG
10500
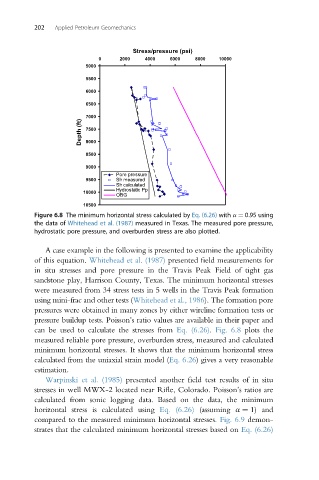
Figure 6.8 The minimum horizontal stress calculated by Eq. (6.26) with a ¼ 0.95 using
the data of Whitehead et al. (1987) measured in Texas. The measured pore pressure,
hydrostatic pore pressure, and overburden stress are also plotted.
A case example in the following is presented to examine the applicability
of this equation. Whitehead et al. (1987) presented field measurements for
in situ stresses and pore pressure in the Travis Peak Field of tight gas
sandstone play, Harrison County, Texas. The minimum horizontal stresses
were measured from 34 stress tests in 5 wells in the Travis Peak formation
using mini-frac and other tests (Whitehead et al., 1986). The formation pore
pressures were obtained in many zones by either wireline formation tests or
pressure buildup tests. Poisson’s ratio values are available in their paper and
can be used to calculate the stresses from Eq. (6.26). Fig. 6.8 plots the
measured reliable pore pressure, overburden stress, measured and calculated
minimum horizontal stresses. It shows that the minimum horizontal stress
calculated from the uniaxial strain model (Eq. 6.26) gives a very reasonable
estimation.
Warpinski et al. (1985) presented another field test results of in situ
stresses in well MWX-2 located near Rifle, Colorado. Poisson’s ratios are
calculated from sonic logging data. Based on the data, the minimum
horizontal stress is calculated using Eq. (6.26) (assuming a ¼ 1) and
compared to the measured minimum horizontal stresses. Fig. 6.9 demon-
strates that the calculated minimum horizontal stresses based on Eq. (6.26)