
Page 49 - Applied Petroleum Geomechanics
P. 49
40 Applied Petroleum Geomechanics
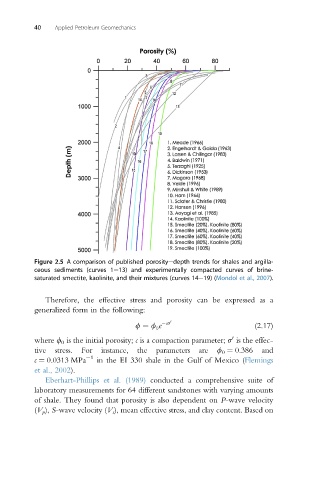
Figure 2.5 A comparison of published porosityedepth trends for shales and argilla-
ceous sediments (curves 1e13) and experimentally compacted curves of brine-
saturated smectite, kaolinite, and their mixtures (curves 14e19) (Mondol et al., 2007).
Therefore, the effective stress and porosity can be expressed as a
generalized form in the following:
f ¼ f e cs 0 (2.17)
0
0
where f 0 is the initial porosity; c is a compaction parameter; s is the effec-
tive stress. For instance, the parameters are f 0 ¼ 0.386 and
c ¼ 0.0313 MPa 1 in the EI 330 shale in the Gulf of Mexico (Flemings
et al., 2002).
Eberhart-Phillips et al. (1989) conducted a comprehensive suite of
laboratory measurements for 64 different sandstones with varying amounts
of shale. They found that porosity is also dependent on P-wave velocity
(V p ), S-wave velocity (V s ), mean effective stress, and clay content. Based on