
Page 54 - Applied Petroleum Geomechanics
P. 54
Rock physical and mechanical properties 45
8
Trendline
7 From Domenico (1976)
From Tosaya (1982)
6 From Johnston (1978)
From Gregory (1976)
5 From Castagna (1985)
Vp/Vs 4
From Hamilton (1971)
3
2
1
0
0 0.2 0.4 0.6 0.8 1
Porosity
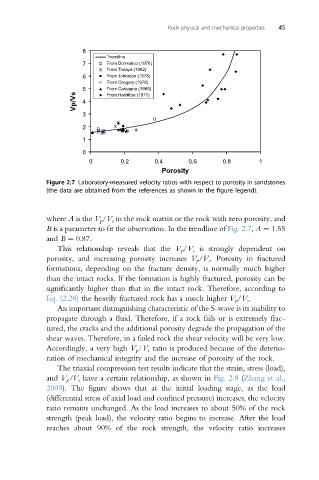
Figure 2.7 Laboratory-measured velocity ratios with respect to porosity in sandstones
(the data are obtained from the references as shown in the figure legend).
where A is the V p /V s in the rock matrix or the rock with zero porosity, and
B is a parameter to fit the observation. In the trendline of Fig. 2.7, A ¼ 1.55
and B ¼ 0.87.
This relationship reveals that the V p /V s is strongly dependent on
porosity, and increasing porosity increases V p /V s . Porosity in fractured
formations, depending on the fracture density, is normally much higher
than the intact rocks. If the formation is highly fractured, porosity can be
significantly higher than that in the intact rock. Therefore, according to
Eq. (2.28) the heavily fractured rock has a much higher V p /V s .
An important distinguishing characteristic of the S-wave is its inability to
propagate through a fluid. Therefore, if a rock fails or is extremely frac-
tured, the cracks and the additional porosity degrade the propagation of the
shear waves. Therefore, in a failed rock the shear velocity will be very low.
Accordingly, a very high V p /V s ratio is produced because of the deterio-
ration of mechanical integrity and the increase of porosity of the rock.
The triaxial compression test results indicate that the strain, stress (load),
and V p /V s have a certain relationship, as shown in Fig. 2.8 (Zhang et al.,
2009). The figure shows that at the initial loading stage, as the load
(differential stress of axial load and confined pressure) increases, the velocity
ratio remains unchanged. As the load increases to about 50% of the rock
strength (peak load), the velocity ratio begins to increase. After the load
reaches about 90% of the rock strength, the velocity ratio increases