
Page 55 - Applied Petroleum Geomechanics
P. 55
46 Applied Petroleum Geomechanics
2.2 14000
2.1 Vp/Vs 12000
Stress
10000
2
Vp/Vs 1.9 8000 Stress difference (psi)
6000
1.8
4000
1.7 2000
1.6 0
0 1 2 3 4 5 6
Strain (1/1000)
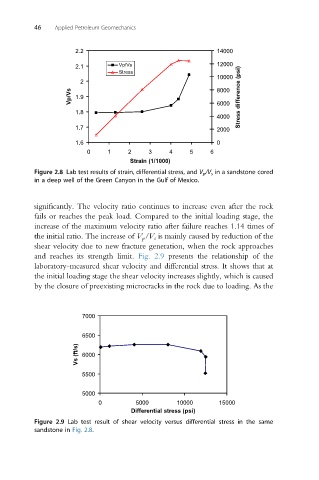
Figure 2.8 Lab test results of strain, differential stress, and V p /V s in a sandstone cored
in a deep well of the Green Canyon in the Gulf of Mexico.
significantly. The velocity ratio continues to increase even after the rock
fails or reaches the peak load. Compared to the initial loading stage, the
increase of the maximum velocity ratio after failure reaches 1.14 times of
the initial ratio. The increase of V p /V s is mainly caused by reduction of the
shear velocity due to new fracture generation, when the rock approaches
and reaches its strength limit. Fig. 2.9 presents the relationship of the
laboratory-measured shear velocity and differential stress. It shows that at
the initial loading stage the shear velocity increases slightly, which is caused
by the closure of preexisting microcracks in the rock due to loading. As the
7000
6500
Vs (ft/s) 6000
5500
5000
0 5000 10000 15000
Differential stress (psi)
Figure 2.9 Lab test result of shear velocity versus differential stress in the same
sandstone in Fig. 2.8.