
Page 57 - Applied Petroleum Geomechanics
P. 57
48 Applied Petroleum Geomechanics
(A) (B)
10000
16,000
9000 Castagna 1985 15,000 SWELL
Olympia Minerals 14,000 Vp wireline
8000
Vs (ft/sec) 7000 Vp (ft/sec) 13,000
12,000
11,000
6000
5000 10,000
9,000
4000 8,000
4000 6000 8000 10000 120001400016000 2.4 2.5 2.6 2.7 2.8 2.9
Vp (ft/sec) Rhob (g/cc)
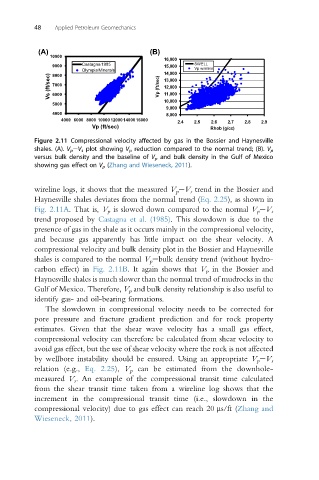
Figure 2.11 Compressional velocity affected by gas in the Bossier and Haynesville
shales. (A). V p eV s plot showing V p reduction compared to the normal trend; (B). V p
versus bulk density and the baseline of V p and bulk density in the Gulf of Mexico
showing gas effect on V p (Zhang and Wieseneck, 2011).
wireline logs, it shows that the measured V p eV s trend in the Bossier and
Haynesville shales deviates from the normal trend (Eq. 2.25), as shown in
Fig. 2.11A. That is, V p is slowed down compared to the normal V p eV s
trend proposed by Castagna et al. (1985). This slowdown is due to the
presence of gas in the shale as it occurs mainly in the compressional velocity,
and because gas apparently has little impact on the shear velocity. A
compressional velocity and bulk density plot in the Bossier and Haynesville
shales is compared to the normal V p ebulk density trend (without hydro-
carbon effect) in Fig. 2.11B. It again shows that V p in the Bossier and
Haynesville shales is much slower than the normal trend of mudrocks in the
Gulf of Mexico. Therefore, V p and bulk density relationship is also useful to
identify gas- and oil-bearing formations.
The slowdown in compressional velocity needs to be corrected for
pore pressure and fracture gradient prediction and for rock property
estimates. Given that the shear wave velocity has a small gas effect,
compressional velocity can therefore be calculated from shear velocity to
avoid gas effect, but the use of shear velocity where the rock is not affected
by wellbore instability should be ensured. Using an appropriate V p eV s
relation (e.g., Eq. 2.25), V p can be estimated from the downhole-
measured V s . An example of the compressional transit time calculated
from the shear transit time taken from a wireline log shows that the
increment in the compressional transit time (i.e., slowdown in the
compressional velocity) due to gas effect can reach 20 ms/ft (Zhang and
Wieseneck, 2011).