
Page 61 - Applied Petroleum Geomechanics
P. 61
52 Applied Petroleum Geomechanics
0.01
Tight sandstone
Shale gas forma on
Permeability (mD) 0.0001
Expon. (Tight sandstone)
0.001
0.00001
0 2 4 6 8 10 12 14
Porosity (%)
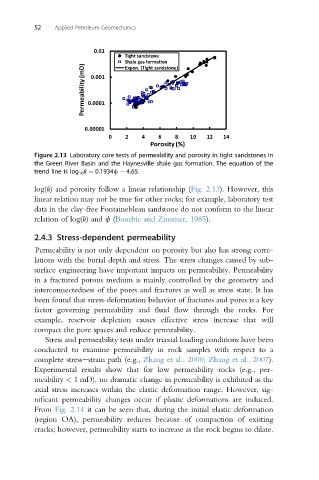
Figure 2.13 Laboratory core tests of permeability and porosity in tight sandstones in
the Green River Basin and the Haynesville shale gas formation. The equation of the
trend line is log 10 k ¼ 0.1934f 4.65.
log(k) and porosity follow a linear relationship (Fig. 2.13). However, this
linear relation may not be true for other rocks; for example, laboratory test
data in the clay-free Fontainebleau sandstone do not conform to the linear
relation of log(k) and f (Bourbie and Zinszner, 1985).
2.4.3 Stress-dependent permeability
Permeability is not only dependent on porosity but also has strong corre-
lations with the burial depth and stress. The stress changes caused by sub-
surface engineering have important impacts on permeability. Permeability
in a fractured porous medium is mainly controlled by the geometry and
interconnectedness of the pores and fractures as well as stress state. It has
been found that stress-deformation behavior of fractures and pores is a key
factor governing permeability and fluid flow through the rocks. For
example, reservoir depletion causes effective stress increase that will
compact the pore spaces and reduce permeability.
Stress and permeability tests under triaxial loading conditions have been
conducted to examine permeability in rock samples with respect to a
complete stressestrain path (e.g., Zhang et al., 2000; Zhang et al., 2007).
Experimental results show that for low permeability rocks (e.g., per-
meability < 1 mD), no dramatic change in permeability is exhibited as the
axial stress increases within the elastic deformation range. However, sig-
nificant permeability changes occur if plastic deformations are induced.
From Fig. 2.14 it can be seen that, during the initial elastic deformation
(region OA), permeability reduces because of compaction of existing
cracks; however, permeability starts to increase as the rock begins to dilate.