
Page 62 - Applied Petroleum Geomechanics
P. 62
Rock physical and mechanical properties 53
C σ c
σ ci B Region II D σ - ε 1
Axial stress or volumetric strain Dilation O A Region I ε - ε 1 1 Permeability
1
k- ε
v
Axial strain, ε
Contraction 0 Microcracks Crack growth 1
close
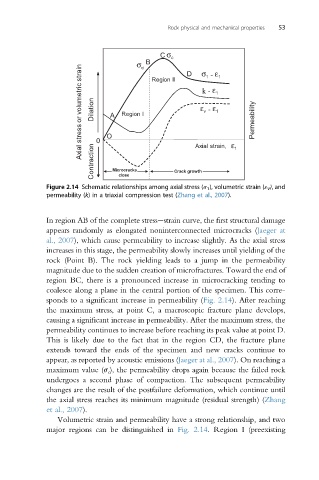
Figure 2.14 Schematic relationships among axial stress (s 1 ), volumetric strain (ε V ), and
permeability (k) in a triaxial compression test (Zhang et al., 2007).
In region AB of the complete stressestrain curve, the first structural damage
appears randomly as elongated noninterconnected microcracks (Jaeger at
al., 2007), which cause permeability to increase slightly. As the axial stress
increases in this stage, the permeability slowly increases until yielding of the
rock (Point B). The rock yielding leads to a jump in the permeability
magnitude due to the sudden creation of microfractures. Toward the end of
region BC, there is a pronounced increase in microcracking tending to
coalesce along a plane in the central portion of the specimen. This corre-
sponds to a significant increase in permeability (Fig. 2.14). After reaching
the maximum stress, at point C, a macroscopic fracture plane develops,
causing a significant increase in permeability. After the maximum stress, the
permeability continues to increase before reaching its peak value at point D.
This is likely due to the fact that in the region CD, the fracture plane
extends toward the ends of the specimen and new cracks continue to
appear, as reported by acoustic emissions (Jaeger at al., 2007). On reaching a
maximum value (s c ), the permeability drops again because the failed rock
undergoes a second phase of compaction. The subsequent permeability
changes are the result of the postfailure deformation, which continue until
the axial stress reaches its minimum magnitude (residual strength) (Zhang
et al., 2007).
Volumetric strain and permeability have a strong relationship, and two
major regions can be distinguished in Fig. 2.14. Region I (preexisting