
Page 56 - Applied Petroleum Geomechanics
P. 56
Rock physical and mechanical properties 47
load approaches and reaches the rock strength, the rock begins to fail,
consequently creating new fractures. The new fractures increase porosity
and cause the shear velocity to decrease dramatically (Fig. 2.9). However,
the compressional velocity only changes slightly throughout the loading
process. Because of this characteristic, the compressional velocity (V p )or
compressional transit time is better than the shear velocity to be used for
rock property estimate.
2.3.5 Fluid (gas) effect on V p and V s
Fluid saturation and stress level have a significant influence on V p . Labo-
ratory experimental results show that nonlinear relationship of V p and stress
exists with a hydrostatic loading in sandstones (King, 1966). It is found that
the water-saturated sandstone has a much higher V p than its dry state. The
kerosene-saturated sandstone has a lower velocity than that in water-
saturated. However, shear wave velocity reduces when a rock sample is
saturated with a liquid.
Compressional velocity or transit time plays a key role in pore pressure
and fracture gradient prediction and for rock property estimates. However,
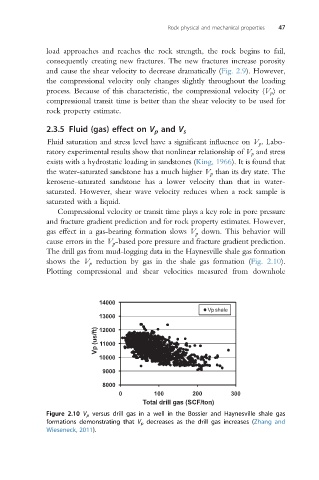
gas effect in a gas-bearing formation slows V p down. This behavior will
cause errors in the V p -based pore pressure and fracture gradient prediction.
The drill gas from mud-logging data in the Haynesville shale gas formation
shows the V p reduction by gas in the shale gas formation (Fig. 2.10).
Plotting compressional and shear velocities measured from downhole
14000
Vp shale
13000
Vp (us/ft) 12000
11000
10000
9000
8000
0 100 200 300
Total drill gas (SCF/ton)
Figure 2.10 V p versus drill gas in a well in the Bossier and Haynesville shale gas
formations demonstrating that V p decreases as the drill gas increases (Zhang and
Wieseneck, 2011).