
Page 72 - Applied Petroleum Geomechanics
P. 72
Rock physical and mechanical properties 63
160
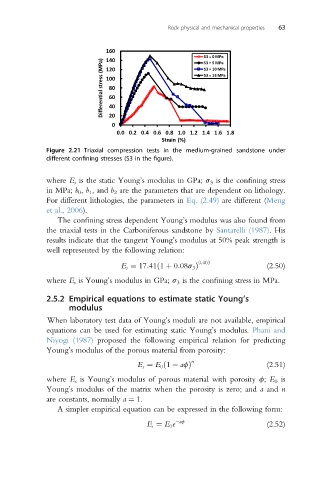
S3 = 0 MPa
140
Differen al stress (MPa) 100 S3 = 15 MPa
S3 = 5 MPa
S3 = 10 MPa
120
80
60
40
20
0
0.0 0.2 0.4 0.6 0.8 1.0 1.2 1.4 1.6 1.8
Strain (%)
Figure 2.21 Triaxial compression tests in the medium-grained sandstone under
different confining stresses (S3 in the figure).
where E s is the static Young’s modulus in GPa; s 3 is the confining stress
in MPa; b 0 , b 1 , and b 2 are the parameters that are dependent on lithology.
For different lithologies, the parameters in Eq. (2.49) are different (Meng
et al., 2006).
The confining stress dependent Young’s modulus was also found from
the triaxial tests in the Carboniferous sandstone by Santarelli (1987). His
results indicate that the tangent Young’s modulus at 50% peak strength is
well represented by the following relation:
0:403
E s ¼ 17:41ð1 þ 0:08s 3 Þ (2.50)
where E s is Young’s modulus in GPa; s 3 is the confining stress in MPa.
2.5.2 Empirical equations to estimate static Young’s
modulus
When laboratory test data of Young’s moduli are not available, empirical
equations can be used for estimating static Young’s modulus. Phani and
Niyogi (1987) proposed the following empirical relation for predicting
Young’s modulus of the porous material from porosity:
n
E s ¼ E 0 ð1 afÞ (2.51)
where E s is Young’s modulus of porous material with porosity f; E 0 is
Young’s modulus of the matrix when the porosity is zero; and a and n
are constants, normally a ¼ 1.
A simpler empirical equation can be expressed in the following form:
E s ¼ E 0 e af (2.52)