
Page 74 - Applied Petroleum Geomechanics
P. 74
Rock physical and mechanical properties 65
2.5.3 Anisotropic Young’s modulus
Most rocks are anisotropic materials and have a characteristic orientation,
particularly in shale formations where the clay minerals are oriented in the
bedding direction. The shale will be stiffer (with a higher Young’s modulus)
if it is loaded parallel to the bedding direction than that if it is loaded
perpendicular to the same direction. Laboratory uniaxial compression tests
in core samples of the Haynesville shale gas formation show that the hor-
izontal and vertical Young’s moduli are markedly different. The ratio of the
horizontal to vertical Young’s moduli is highly related to the vertical
Young’s modulus (Fig. 2.23), for which following correlation exists:
E h =E V ¼ 10:06E 0:594 (2.57)
V
where E h and E V are the horizontal and vertical Young’s moduli (in GPa),
respectively.
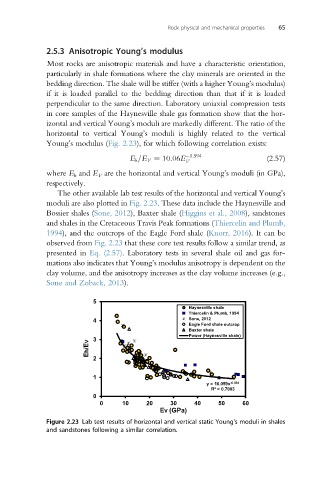
The other available lab test results of the horizontal and vertical Young’s
moduli are also plotted in Fig. 2.23. These data include the Haynesville and
Bossier shales (Sone, 2012), Baxter shale (Higgins et al., 2008), sandstones
and shales in the Cretaceous Travis Peak formations (Thiercelin and Plumb,
1994), and the outcrops of the Eagle Ford shale (Knorr, 2016). It can be
observed from Fig. 2.23 that these core test results follow a similar trend, as
presented in Eq. (2.57). Laboratory tests in several shale oil and gas for-
mations also indicates that Young’s modulus anisotropy is dependent on the
clay volume, and the anisotropy increases as the clay volume increases (e.g.,
Sone and Zoback, 2013).
5
Haynesville shale
Thiercelin & Plumb, 1994
4 Sone, 2012
Eagle Ford shale outcrop
Baxter shale
Power (Haynesville shale)
3
Eh/EV 2
1
y = 10.059x -0.594
R² = 0.7003
0
0 10 20 30 40 50 60
EV (GPa)
Figure 2.23 Lab test results of horizontal and vertical static Young’s moduli in shales
and sandstones following a similar correlation.