
Page 78 - Applied Petroleum Geomechanics
P. 78
Rock physical and mechanical properties 69
(Yale and Jamieson, 1994). The well log derived (dynamic-undrained)
values can be correlated to static, reservoir condition values of Young’s
modulus using a correction factors between 0.68 (for mudstones and silt-
stones) and 0.79 (for dolostones and limestones) depending on lithology.
Combining these factors with Eqs. (2.68) and (2.71), it has the following
generalized relation:
E s ¼ kE d (2.72)
where k is a correlation factor between 0.5 (shales, Eq. (2.71)) and 0.79
(dolostones and limestones, Yale and Jamieson, 1994).
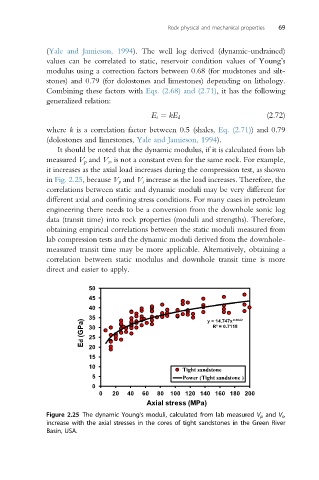
It should be noted that the dynamic modulus, if it is calculated from lab
measured V p and V s , is not a constant even for the same rock. For example,
it increases as the axial load increases during the compression test, as shown
in Fig. 2.25, because V p and V s increase as the load increases. Therefore, the
correlations between static and dynamic moduli may be very different for
different axial and confining stress conditions. For many cases in petroleum
engineering there needs to be a conversion from the downhole sonic log
data (transit time) into rock properties (moduli and strengths). Therefore,
obtaining empirical correlations between the static moduli measured from
lab compression tests and the dynamic moduli derived from the downhole-
measured transit time may be more applicable. Alternatively, obtaining a
correlation between static modulus and downhole transit time is more
direct and easier to apply.
50
45
40
35 y = 14.747x 0.2042
(GPa) 30 R² = 0.7118
Ed 25
20
15
10
Tight sandstone
5 Power (Tight sandstone )
0
0 20 40 60 80 100 120 140 160 180 200
Axial stress (MPa)
Figure 2.25 The dynamic Young’s moduli, calculated from lab measured V p and V s ,
increase with the axial stresses in the cores of tight sandstones in the Green River
Basin, USA.